Important Information
Investors should not base investment decisions on this website alone. Please refer to the Prospectus for details including product features and the risk factors. Investment involves risks. Past performance is not indicative of future performance. There is no guarantee of the repayment of the principal. Investors should note:
- Global X China Global Leaders ETF’s (the “Fund’s”) investment in equity securities is subject to general market risks, whose value may fluctuate due to various factors, such as changes in investment sentiment, political and economic conditions and issuer-specific factors.
- The Fund may invest in small and/or mid-sized companies. The stock of small-capitalisation and mid-capitalisation companies may have lower liquidity and their prices are more volatile to adverse economic developments than those of larger capitalisation companies in general. The Fund’s investments are concentrated in companies which are either headquartered or incorporated in Mainland China, Hong Kong or Macau. The Fund’s value may be more volatile than that of a fund with a more diverse portfolio.
- China is an emerging market. The Fund invests in Chinese companies which may involve increased risks and special considerations not typically associated with investments in more developed markets, such as liquidity risk, currency risks, political risk, legal and taxation risks, and the likelihood of a high degree of volatility.
- The trading price of the Fund’s unit (the “Unit”) on the Stock Exchange of Hong Kong is driven by market factors such as demand and supply of the Unit. Therefore, the Units may trade at a substantial premium or discount to the Fund’s net asset value.
- The Fund’s synthetic replication strategy will involve investing up to 50% of its net asset value in financial derivative instruments (“FDIs”), mainly funded total return swap transaction(s) through one or more counterparty(ies). Risks associated with FDIs include counterparty/credit risk, liquidity risk, valuation risk, volatility risk and over-the-counter transaction risk. FDIs are susceptible to price fluctuations and higher volatility, and may have large bid and offer spreads and no active secondary markets. The leverage element/component of an FDI can result in a loss significantly greater than the amount invested in the FDI by the Sub-Fund.
- As part of the securities lending transactions, there is a risk of shortfall of collateral value due to inaccurate pricing of the securities lent or change of value of securities lent. This may cause significant losses to the Fund. The borrower may fail to return the securities in a timely manner or at all. The Fund may suffer from a loss or delay when recovering the securities lent out. This may restrict the Fund’s ability in meeting delivery or payment obligations from realisation requests.
- Global X Hang Seng TECH ETF (the “Fund”) seeks to provide investment results that, before deduction of fees and expenses, closely correspond to the performance of the Hang Seng TECH Index (the “Index”).
- The Fund’s investments are concentrated in companies with a technology theme. Technology companies are often characterised by relatively higher volatility in price performance. Companies in the technology sector also face intense competition, and there may also be substantial government intervention, which may have an adverse effect on profit margins. These companies are also subject to the risks of loss or impairment of intellectual property rights or licences, cyber security risks resulting in undesirable legal, financial, operational and reputational consequences.
- The Fund’s investments are concentrated in securities listed on the Stock Exchange of Hong Kong (the “SEHK”) of companies that are active in technology sector may result in greater volatility in the value of the Fund than more diverse portfolios which comprise broad-based global investments. The value of the Fund may be more susceptible to adverse economic, political, policy, foreign exchange, liquidity, tax, legal or regulatory event affecting the technology sector.
- The Index is subject to concentration risk as a result of tracking the performance of securities incorporated in, or with majority of revenue derived from, or with a principal place of business in, the Greater China region. The Fund’s NAV is therefore likely to be more volatile than a broad-based fund.
- As part of the securities lending transactions, there is a risk of shortfall of collateral value due to inaccurate pricing of the securities lent or change of value of securities lent. This may cause significant losses to the Fund. The borrower may fail to return the securities in a timely manner or at all. The Fund may suffer from a loss or delay when recovering the securities lent out. This may restrict the Fund’s ability in meeting delivery or payment obligations from realisation requests.
- The trading price of the Fund unit (the “Unit”) on the SEHK is driven by market factors such as demand and supply of the Unit. Therefore, the Units may trade at a substantial premium or discount to the Fund’s net asset value.
- Dividends may be paid from capital or effectively out of capital of the Fund, which may amount to a return or withdrawal of part of an investor’s original investment or from any capital gains attributable to that original investment and result in an immediate reduction in the Net Asset Value per Unit of the Fund.
Product Comparison:
China Global Leaders (3050) vs. HS Tech (2837)
Both China Global Leaders (3050) and HS TECH (2837) have large exposure to China tech industry and have benefited from the tech-centric rally, while we have observed several differences between the two products. In our view, China Global Leaders is a more ideal capture of China high-tech industry and may catch up in terms of performance thanks to its diversified exposure to a broad range of high-tech areas, a methodology focused on large-cap sector leaders and its A share exposure.
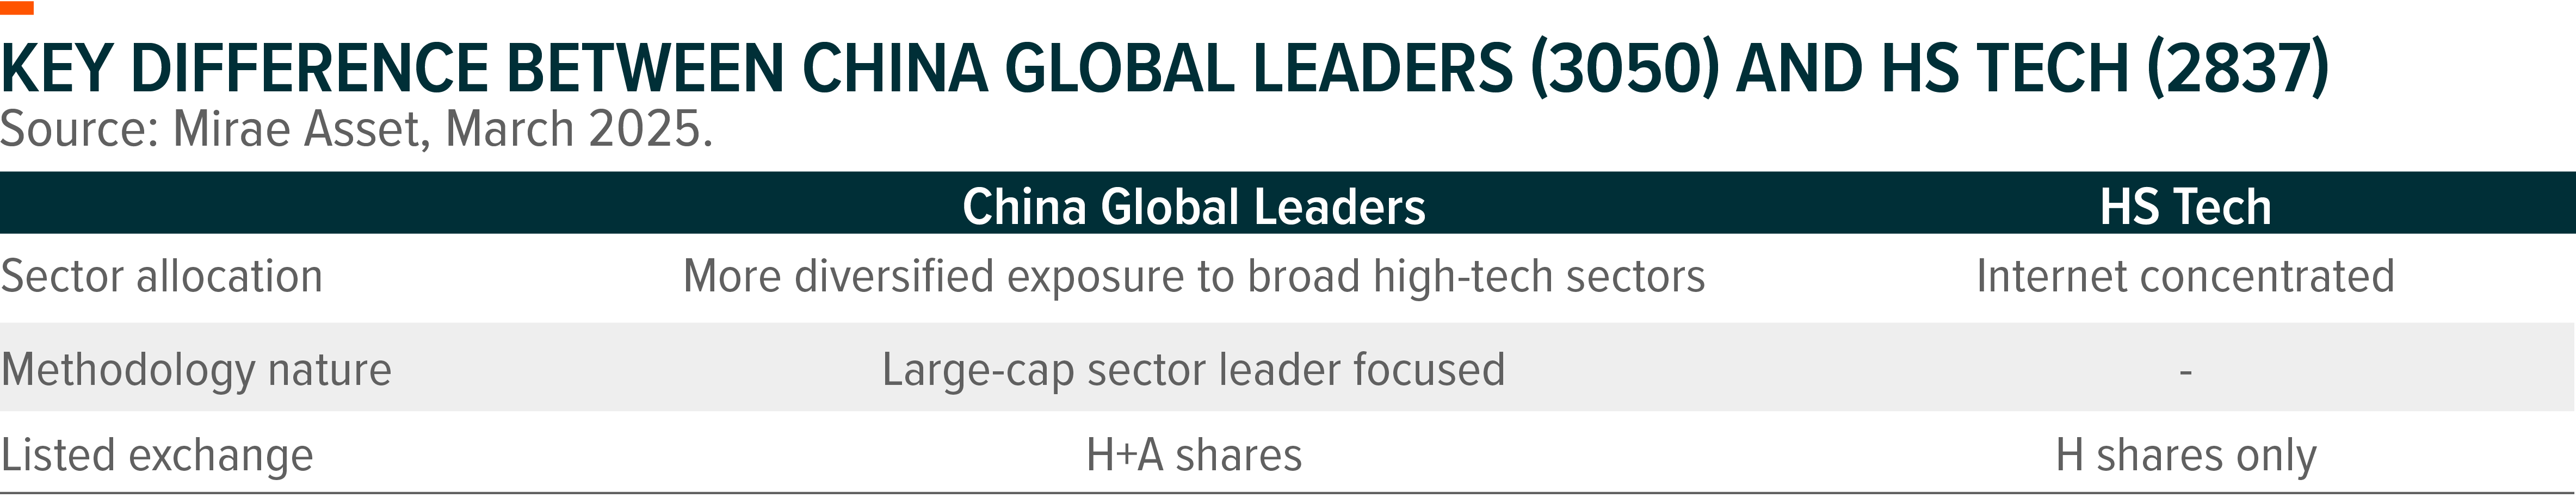
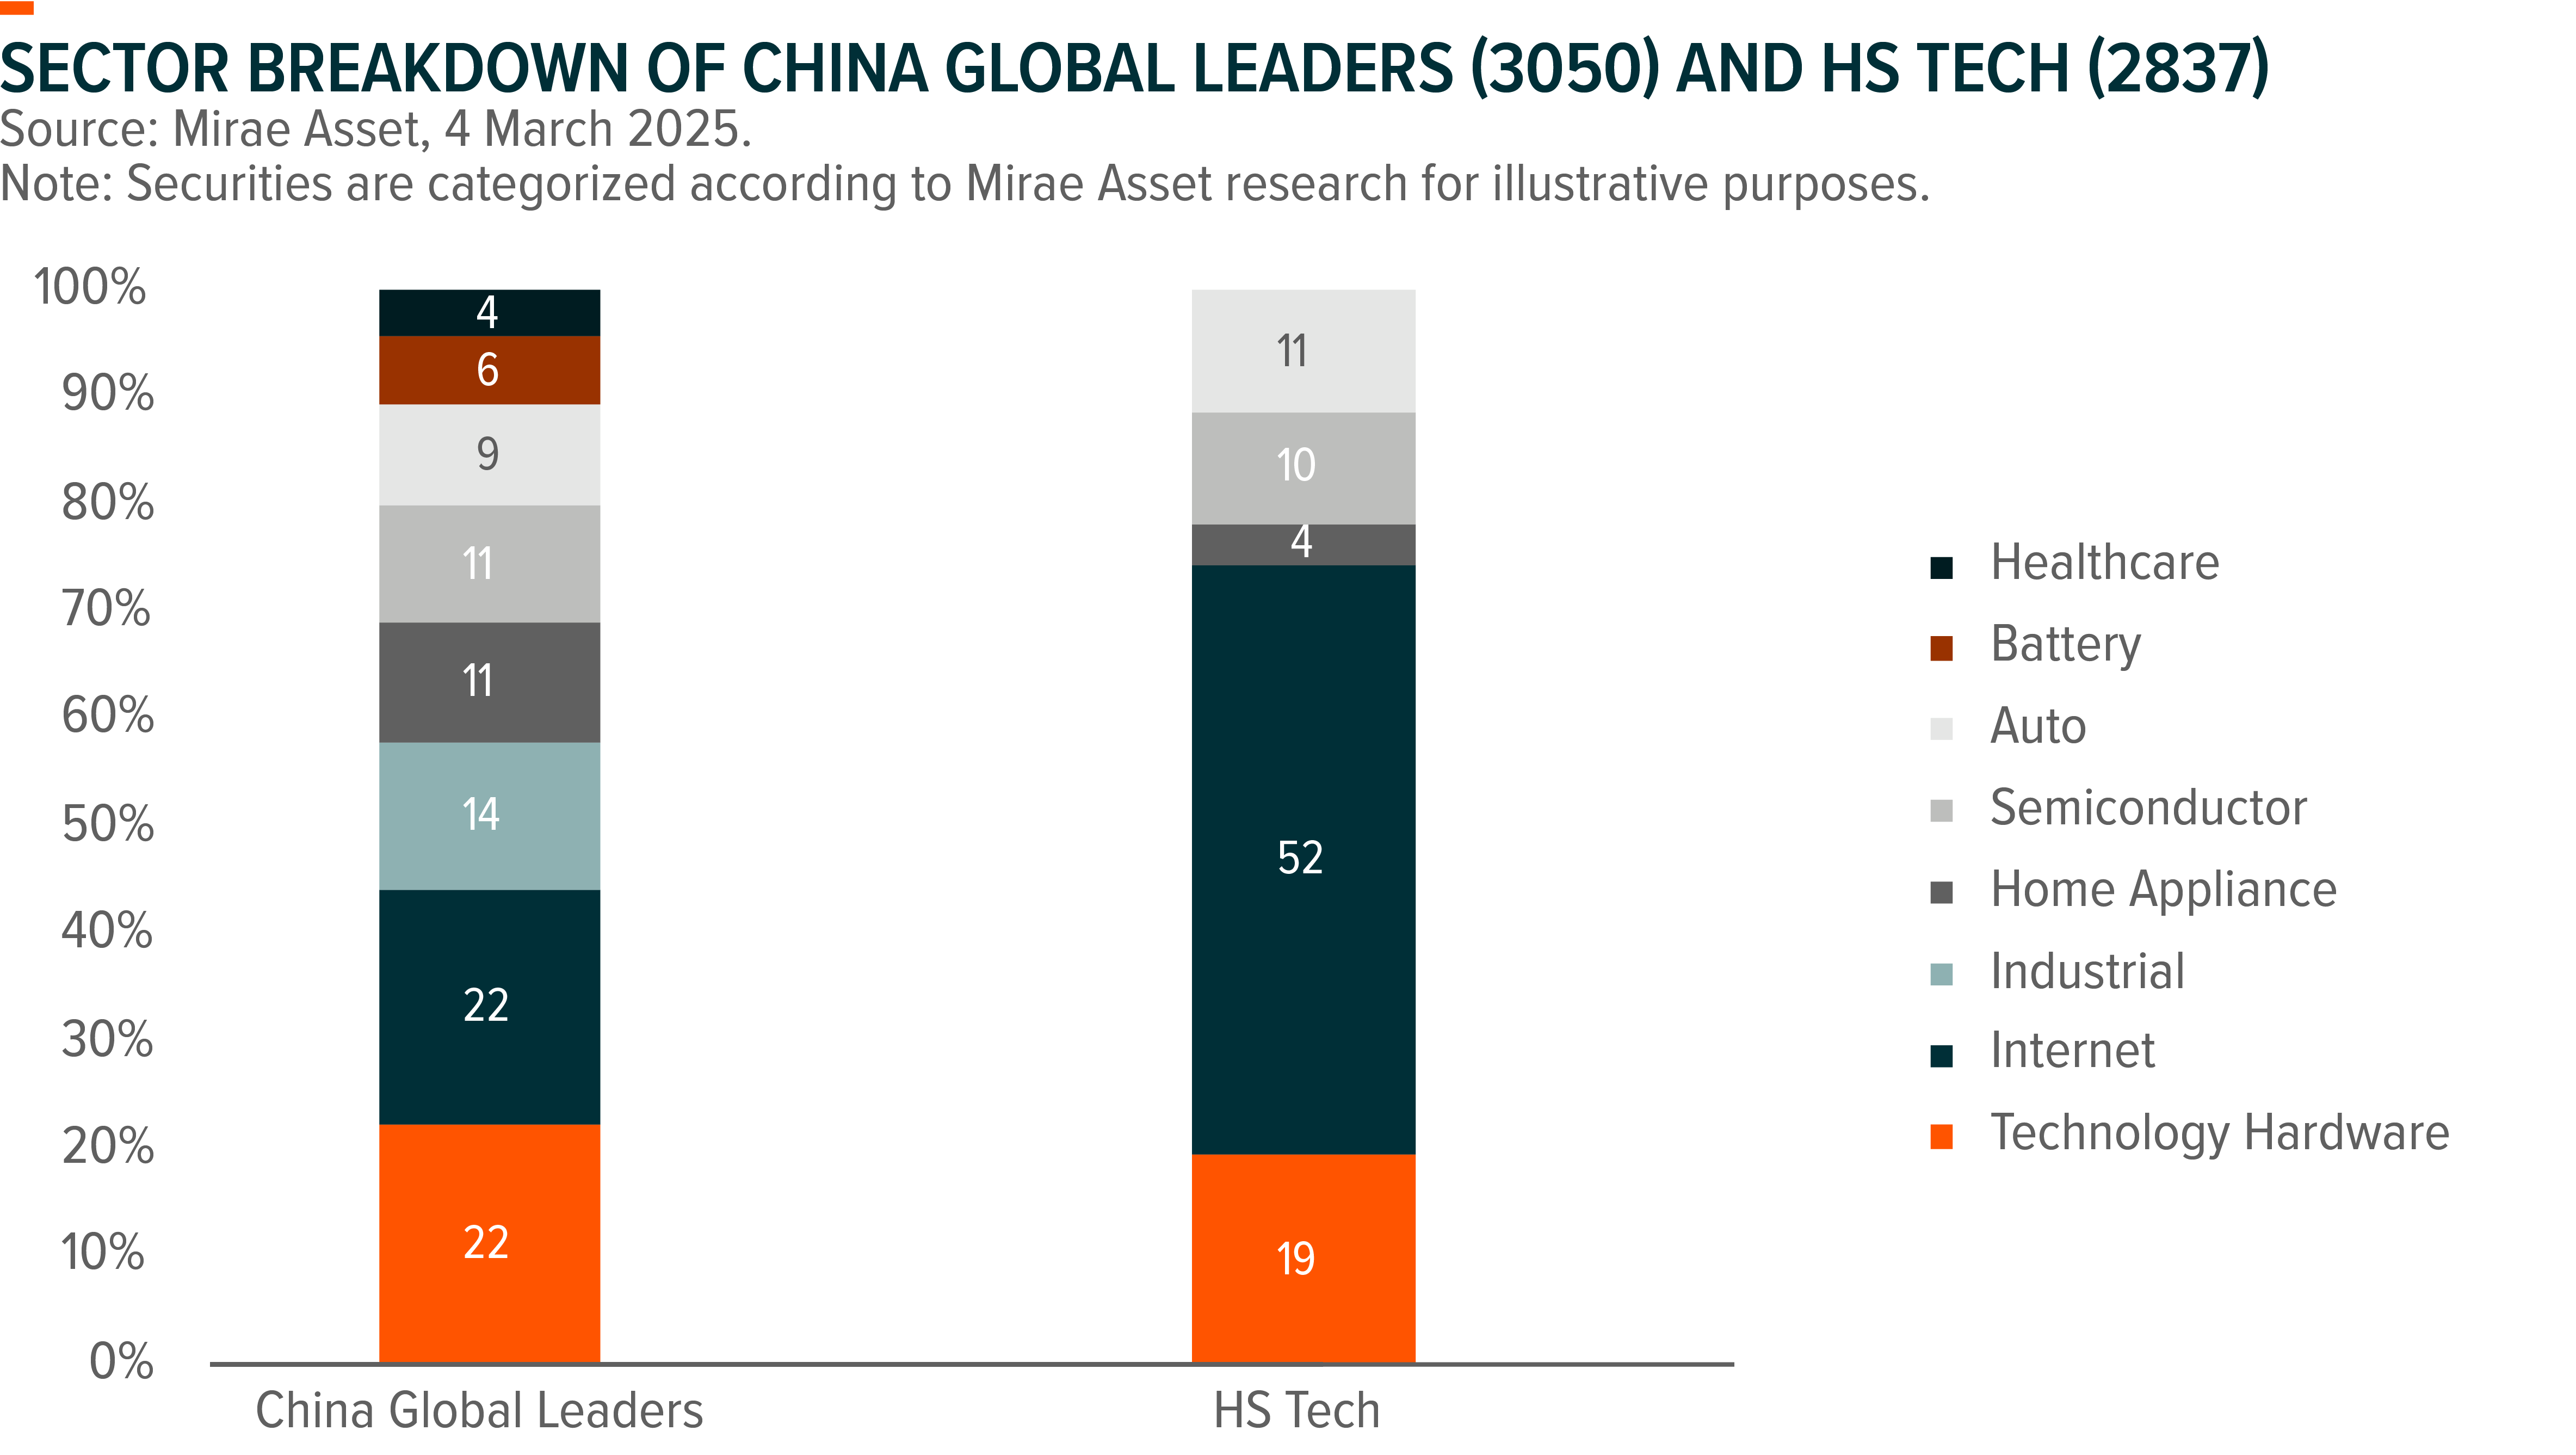
- A More Diversified Portfolio on Broad High-Tech Theme: China Global Leader has greater exposure to high-tech and advanced manufacturing sectors, including technology hardware (22%) and industrials (14%), while HS TECH is more concentrated in internet names (52%).
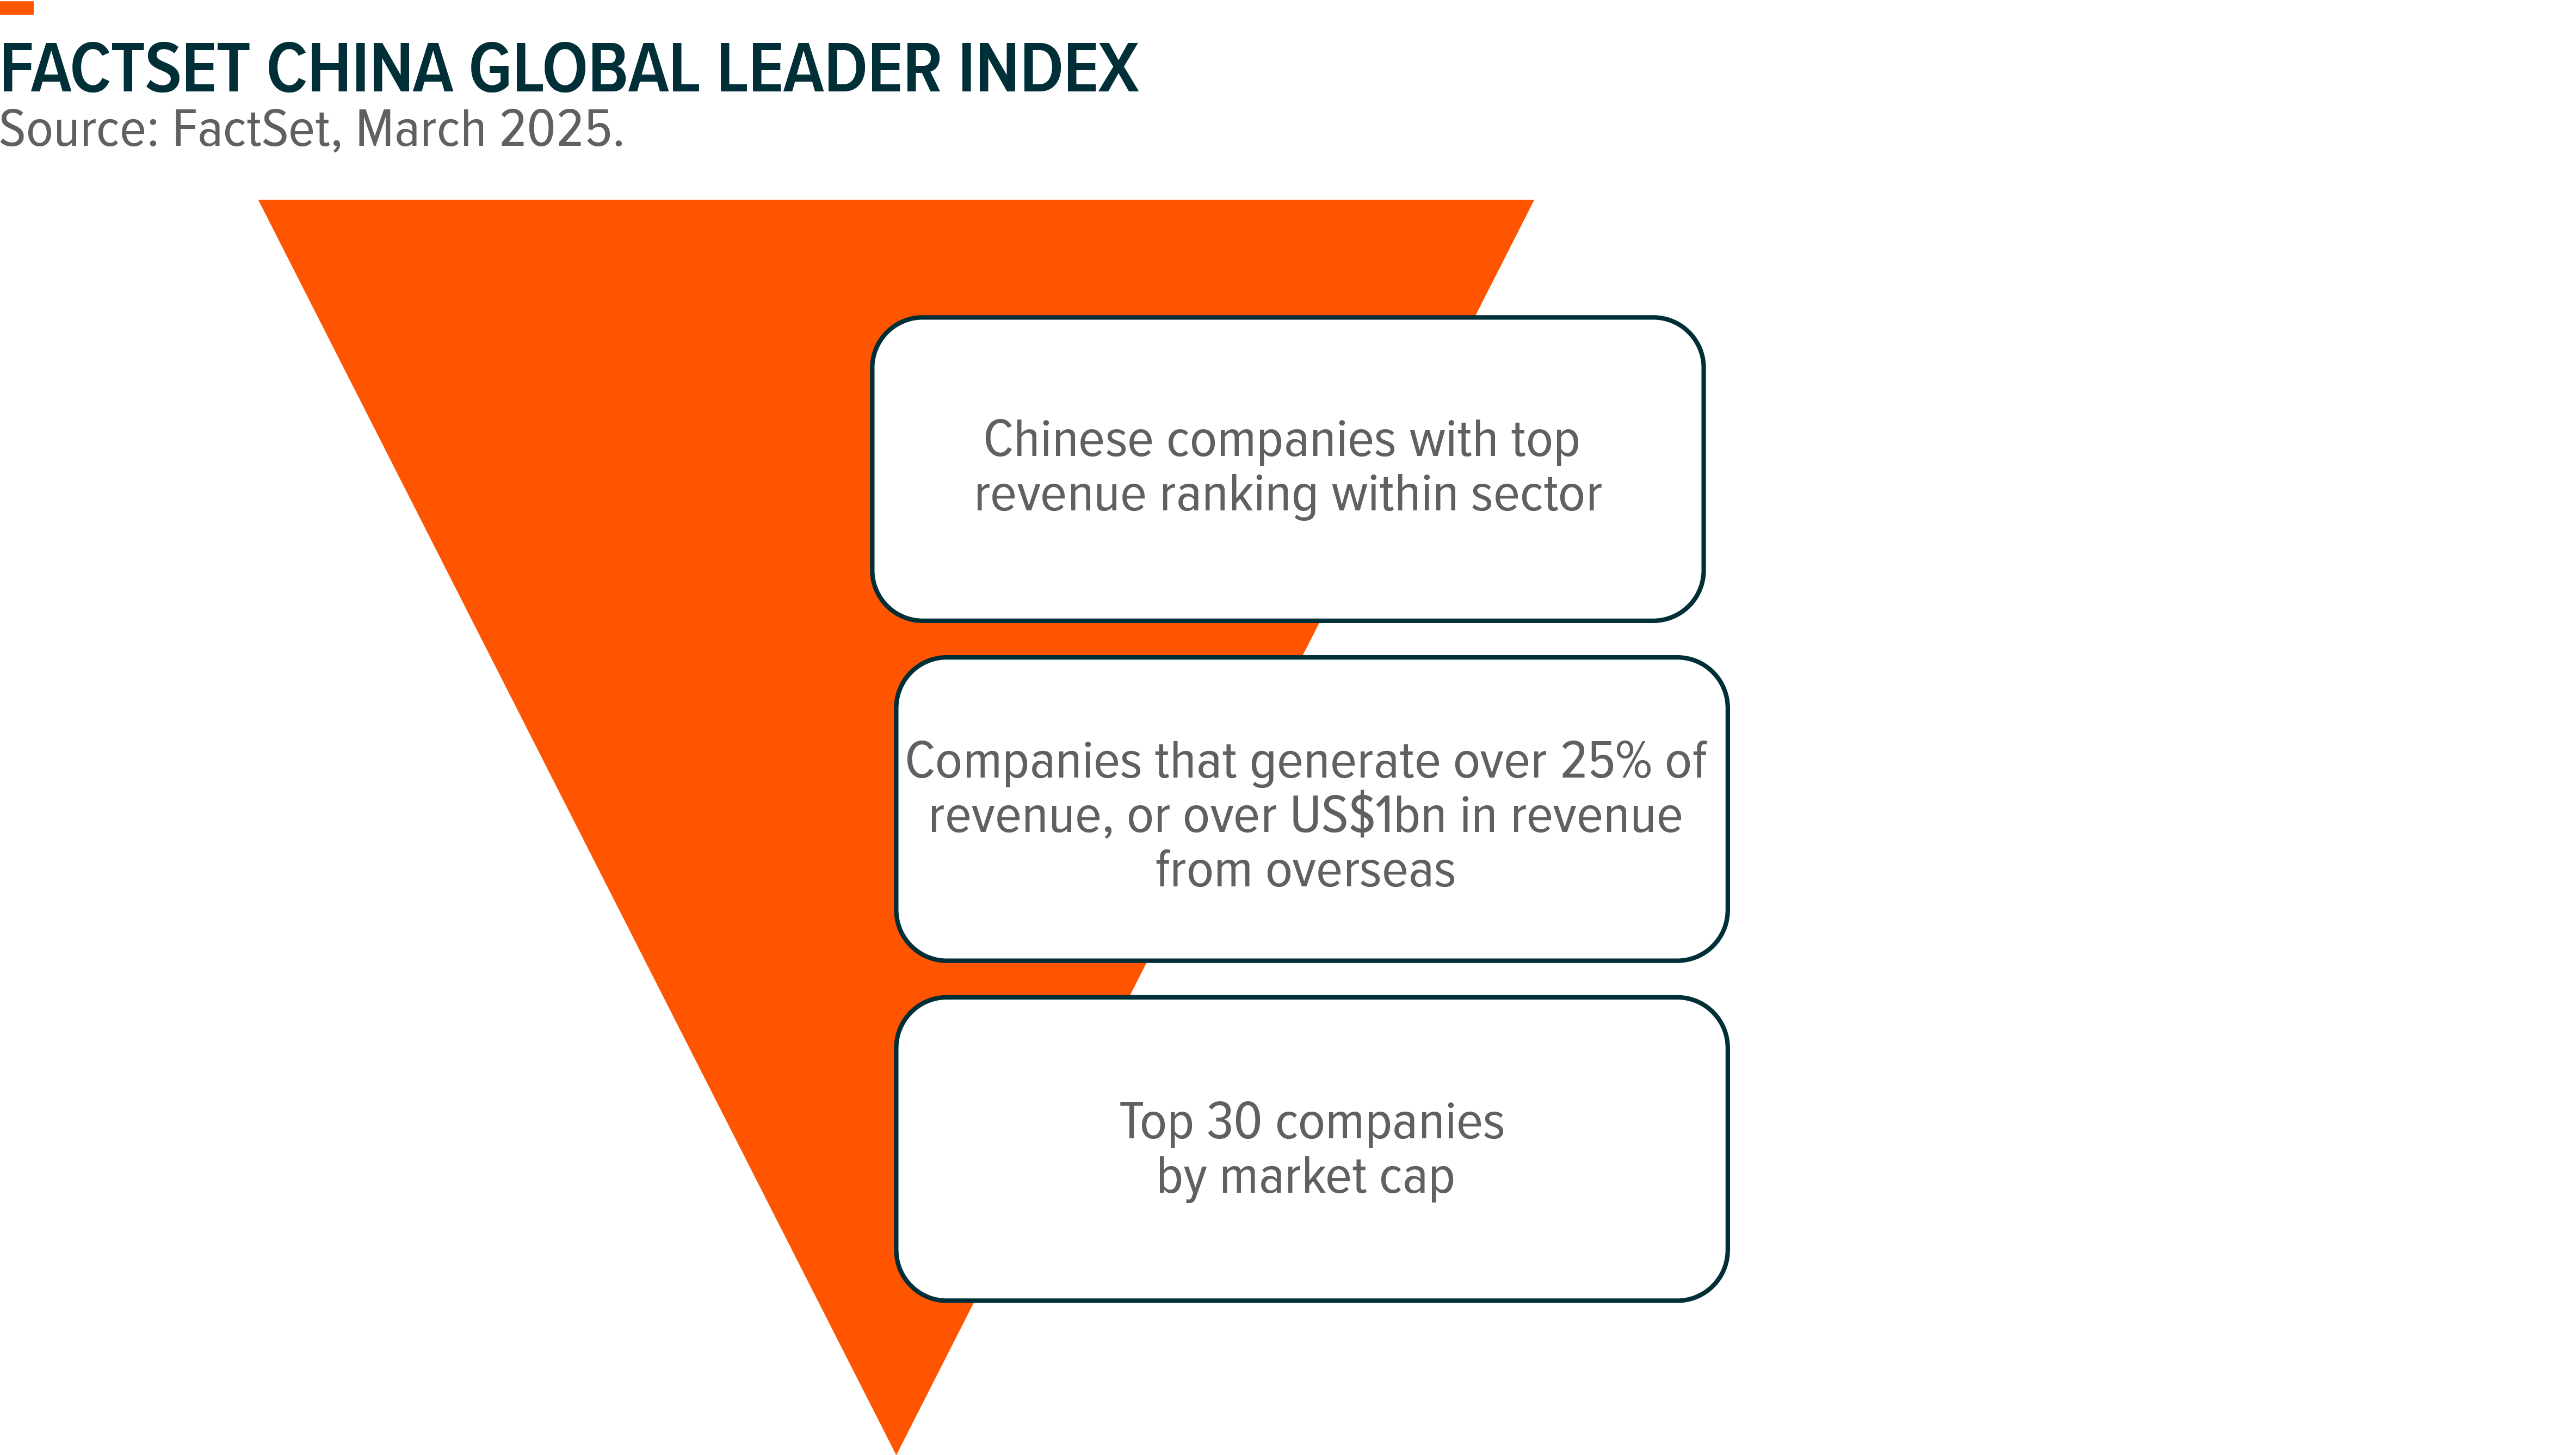
2. Leader-focused Methodology: the index methodology of China Global Leaders Index tend to select large caps names based on their market leadership and strong global presence. First, we select companies that have top revenue ranking within sectors to include sector leaders. Second, we choose companies that derive over 25% of their revenue from international markets or have more than US$1 billion in overseas revenue, thereby identifying firms with a significant global presence. Finally, we focus on the top 30 companies ranked by market cap.
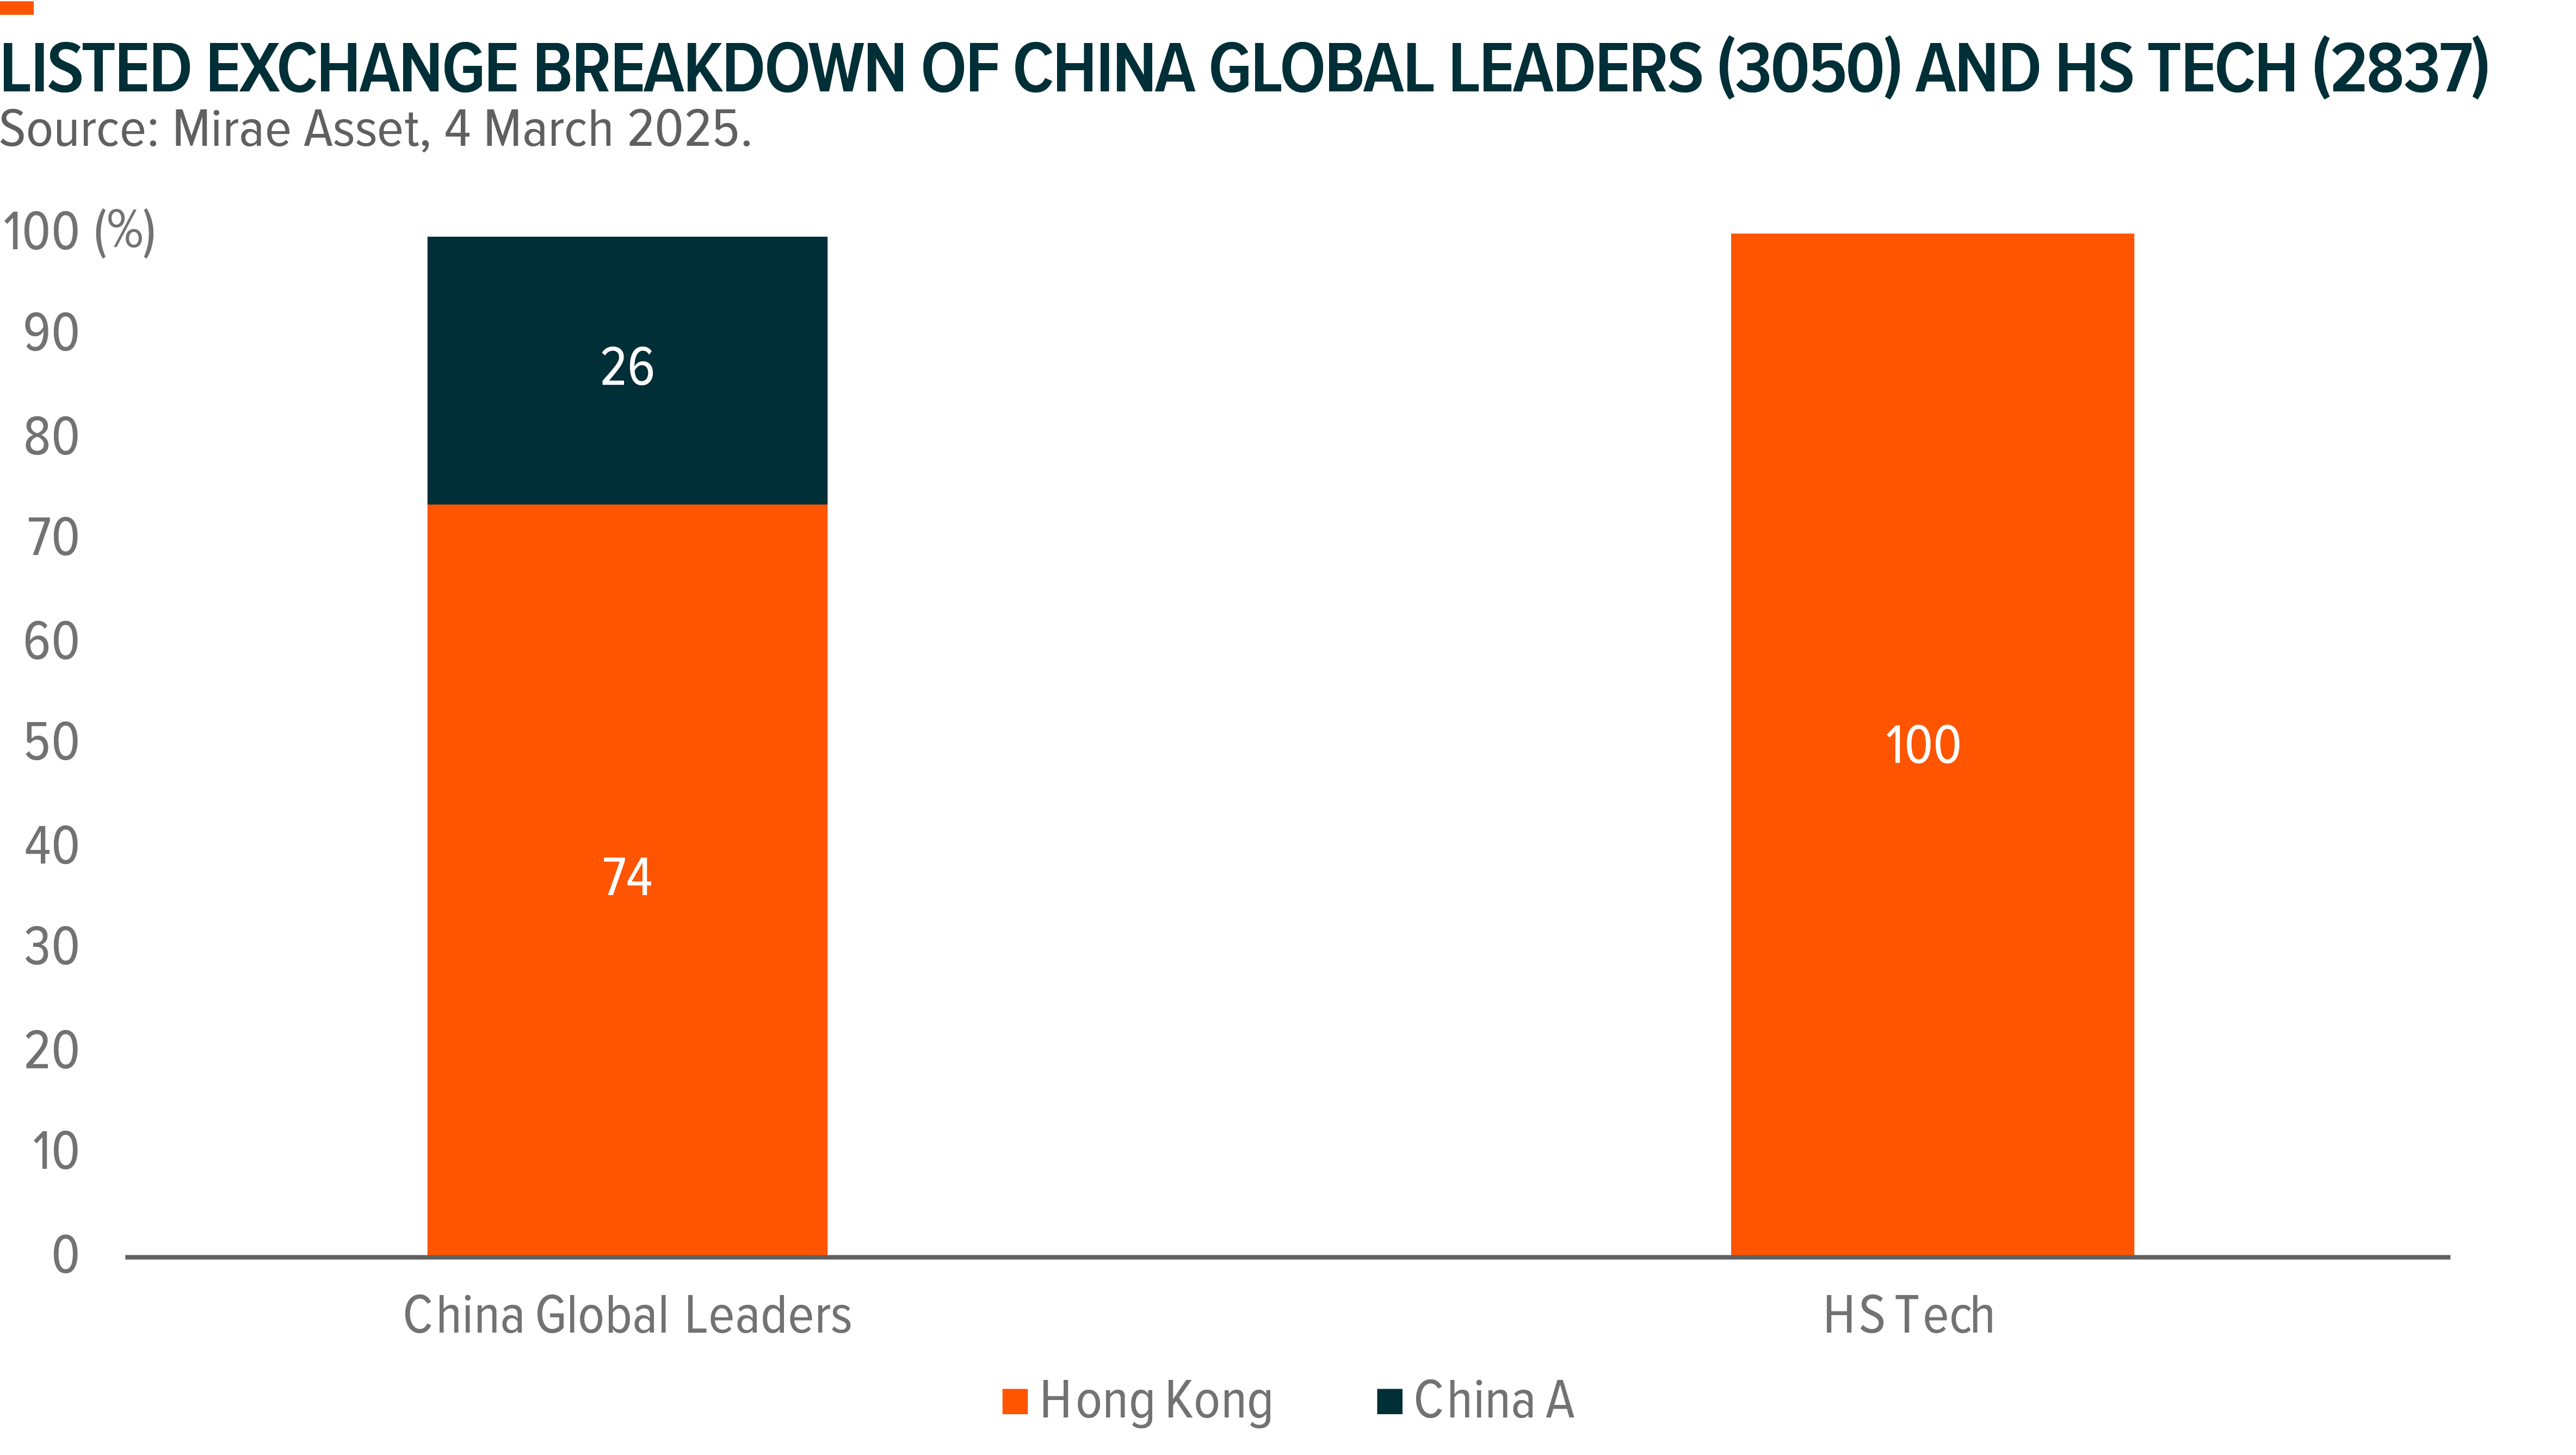
3. China Global Leaders Provide H+A Exposure: China Global Leaders embodies an all-China concept, offering exposure to both H and A shares, with 30% of its holdings in China A shares, while HS TECH are all HK listed companies. Current AI/tech-driven market rally is mainly on H shares, while A shares are likely to catch up with the recovery of China market and improving investor sentiments.
Index Style Analysis
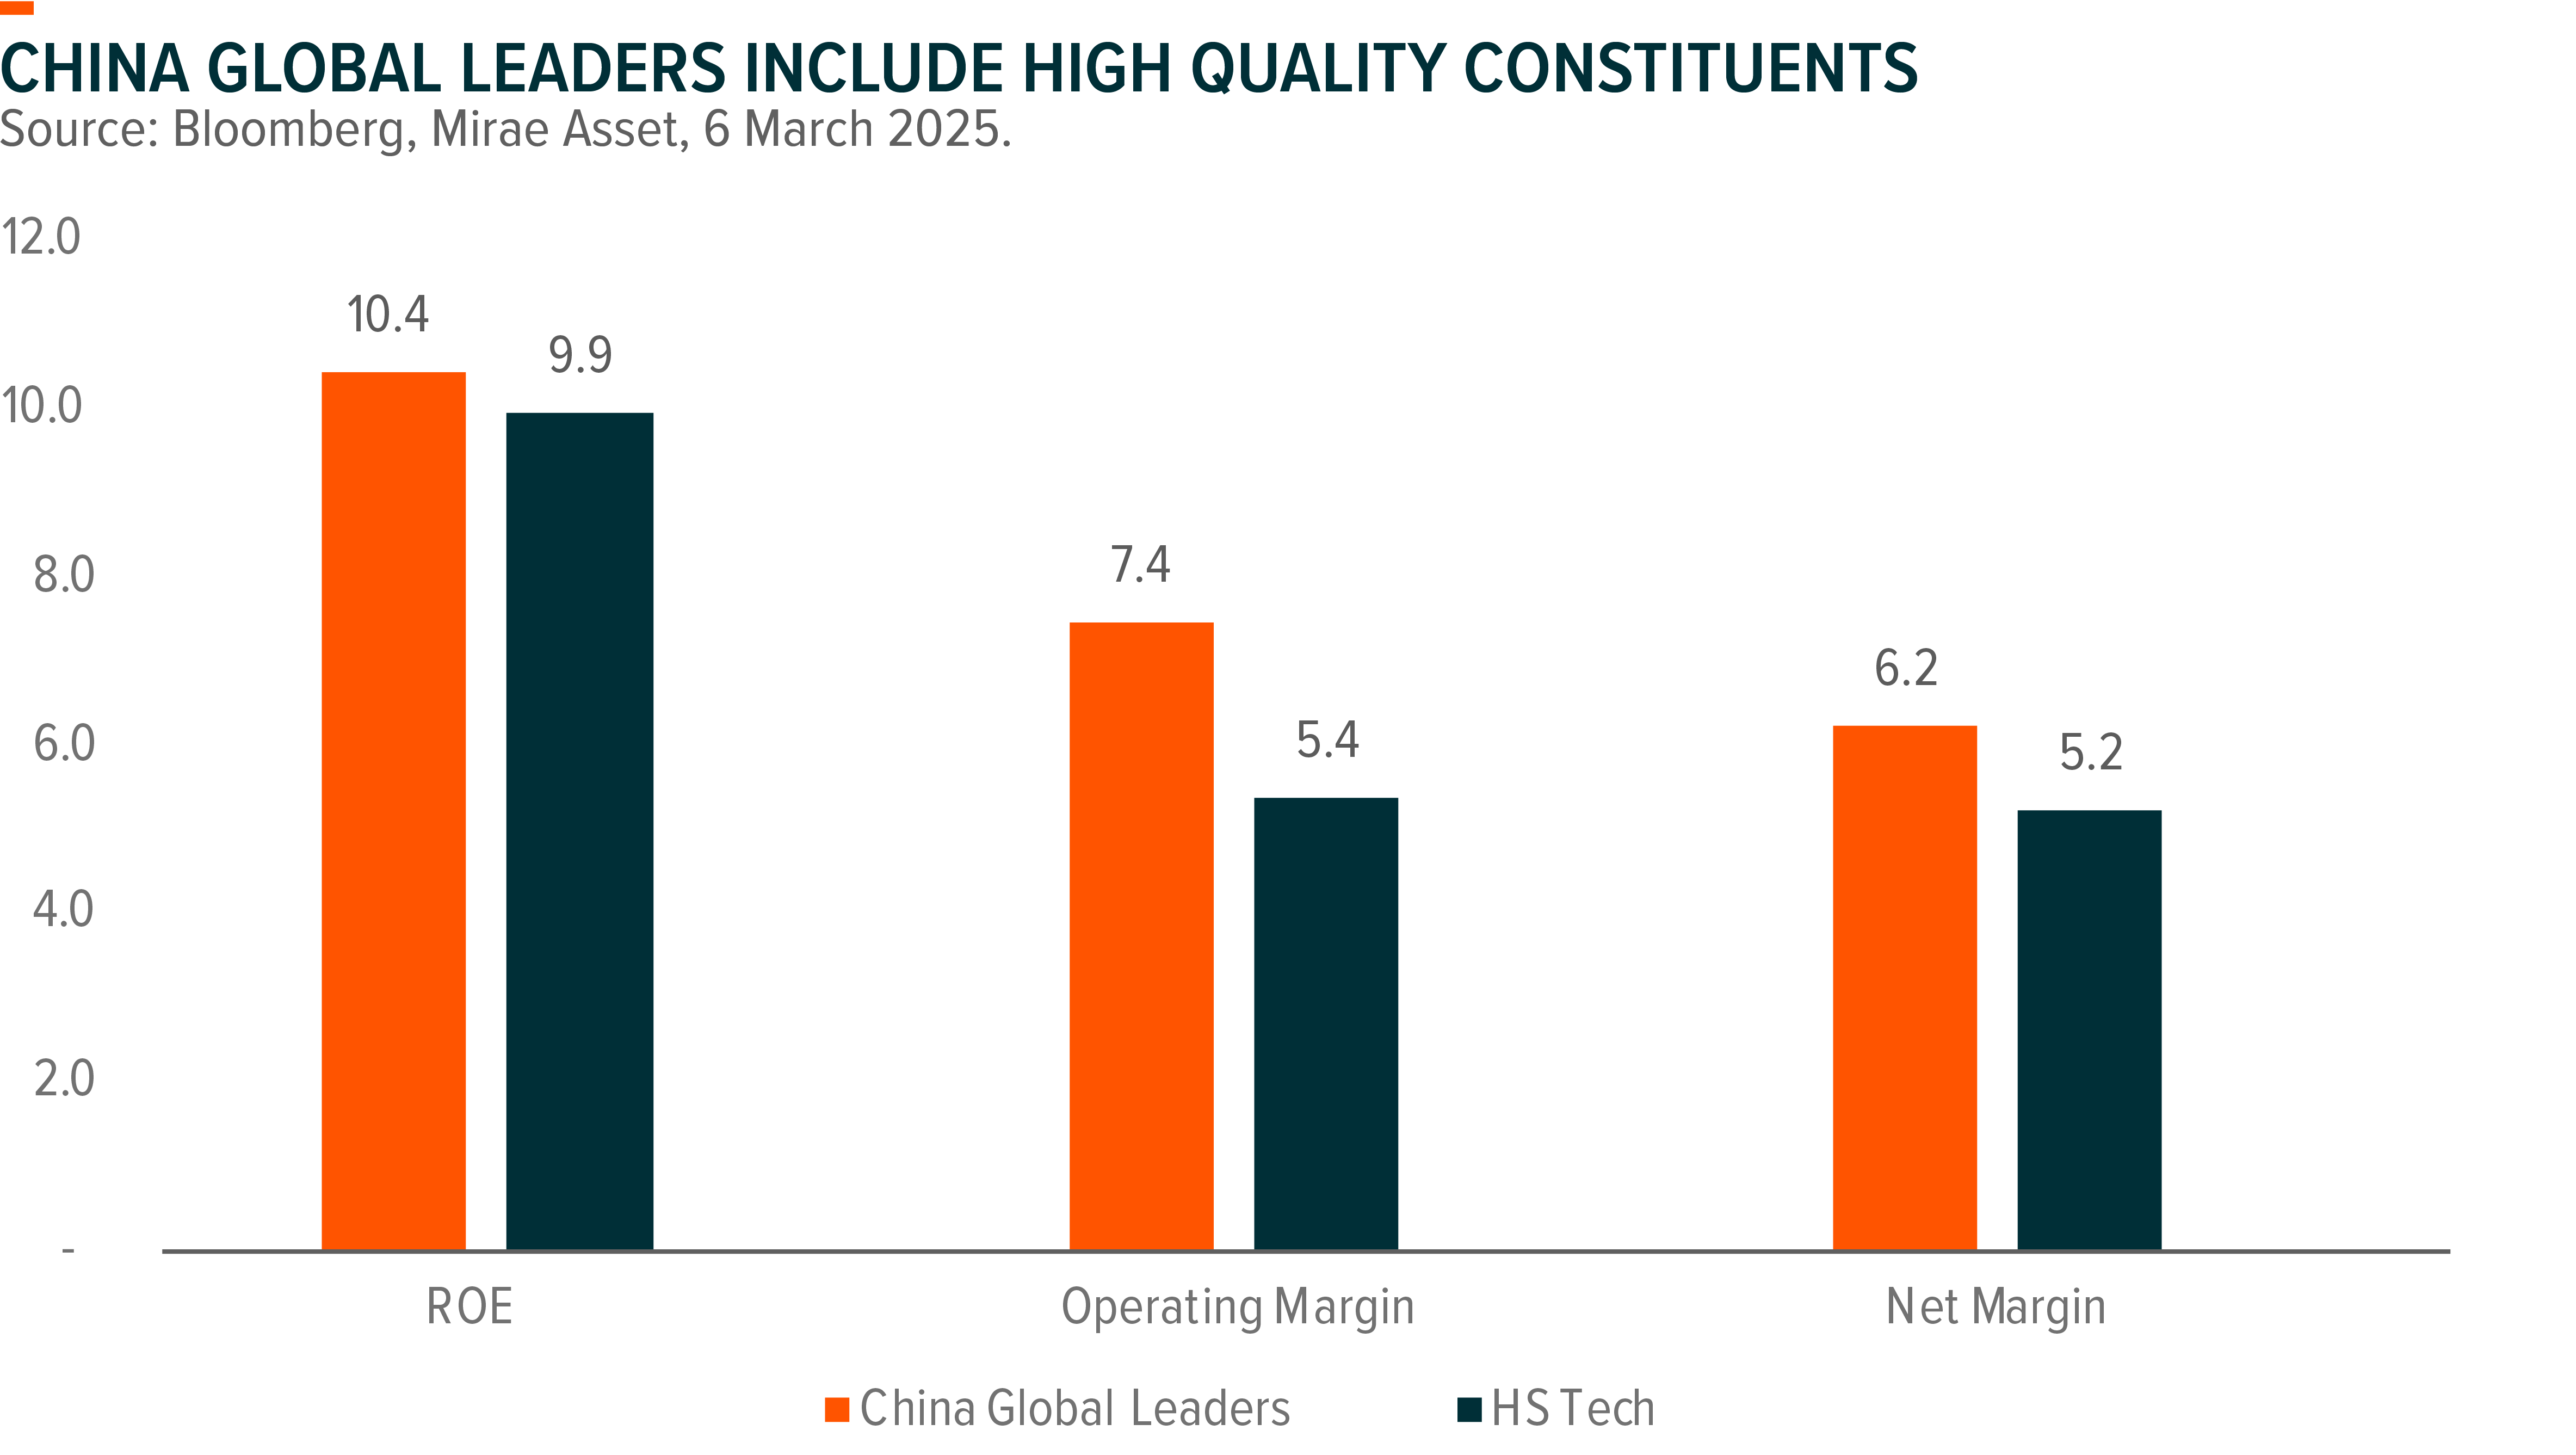
The China Global Leaders Index portfolio has demonstrated higher ROE and better profitability, as it is composed of large-cap sector leaders with robust margin profiles. For instance, while both China Global Leaders Index and HS TECH Index have exposure to the auto sector, China Global Leaders Index primarily includes BYD, a profitable sector leader, while HS TECH Index includes companies like NIO and Xpeng, which are still not profitable.
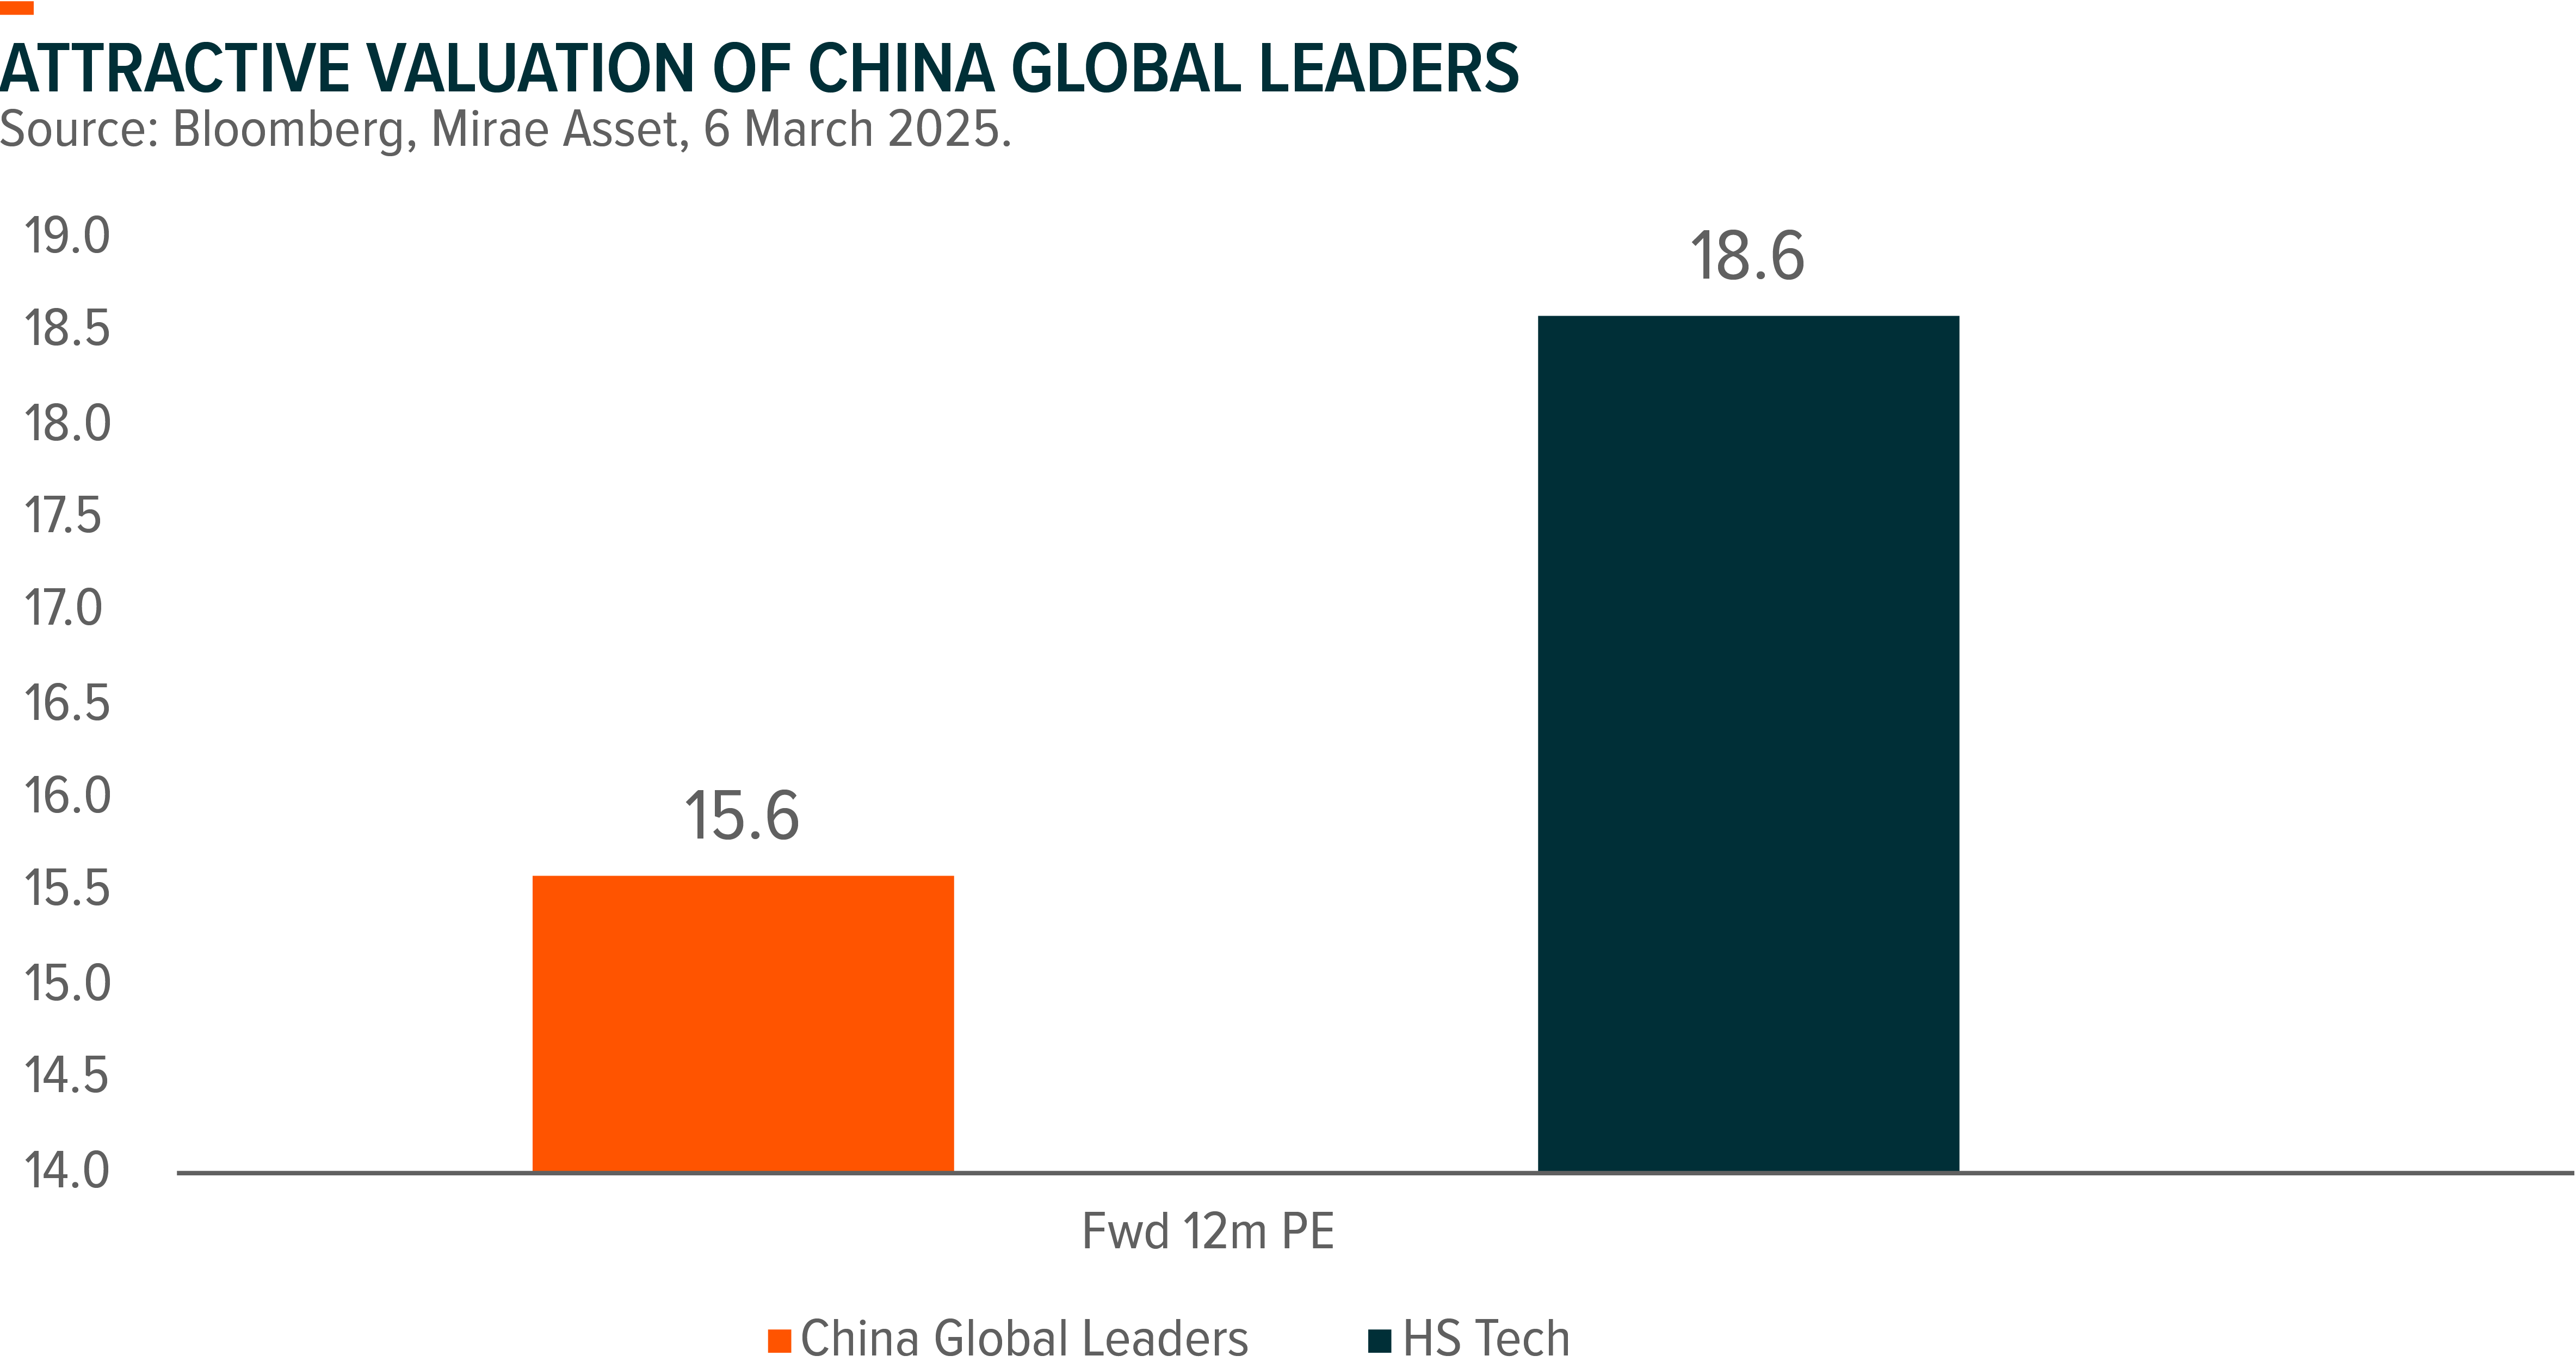
The valuation of China Global Leaders Index is more attractive, as internet names especially software names have surged during current AI-driven market rally, while broader high-tech sectors such as technology hardware and industrials valuation appear to be relatively fair.
| Global X China Global Leaders ETF (3050) |
Global X Hang Seng TECH ETF (2837) |
|
|---|---|---|
| Listing Date | 11 Mar 2021 | 30 Mar 2023 |
| Reference Index | FactSet China Global Leaders Index NTR | Hang Seng TECH Index |
| Primary Exchange | Hong Kong Stock Exchange | Hong Kong Stock Exchange |
| Total Expense Ratio | 0.68% p.a.1 | 0.46% p.a.2 |
| Product Page | Link | Link |
Source: Mirae Asset; Data as of March 2025.

