Important Information
Investors should not base investment decisions on this website alone. Please refer to the Prospectus for details including the product features and the risk factors. Investment involves risks. Past performance is not indicative of future performance. There is no guarantee of the repayment of the principal. Investors should note:
- The investment objective of the Global X KOSPI 200 ETF (the “Fund”) is to provide investment results that, before fees and expenses, closely correspond to the performance of the KOSPI 200 Index.
- The Fund is exposed to concentration risk by tracking a specific region or country (South Korea). The value of the Fund may be more susceptible to adverse economic, political, policy, foreign exchange, liquidity, tax, legal or regulatory events affecting the South Korean market.
- The Korean market is subject to high volatility as a result of high retail trading participation, as well as sudden regulatory shifts and shifts in market sentiment. Trading in the Korean market is also subject to circuit breakers and daily price limits.
- The underlying index of the Fund is heavily concentrated in its top two constituents (i.e. Samsung Electronics Co., Ltd. and SK Hynix Inc., which may account for more than 50% of this product’s Net Asset Value) which are of the same sector (i.e. the electronics and technology hardware industry, focusing on the semiconductor business), making the Fund potentially more volatile than a fund with a diversified portfolio.
- The constituents of the Index include large- or mega-capitalisation companies, which may be subject to slower growth during times of economic expansion and may struggle with flexibility to respond quickly to disruptions and changes in trends.
- The base currency of the Fund is KRW but the trading currency of the Fund is in HKD and USD. The NAV of the Fund and its performance may be affected by fluctuations in the exchange rates between these currencies and the base currency and by changes in exchange rate controls.
- The trading price of the Fund’s unit on the SEHK is driven by secondary market trading factors, which may lead to a substantial premium or discount to the Fund’s net asset value.
- The Manager may at its discretion pay dividends out of the capital of the Fund. Distributions paid out of capital, represent a return of an investor’s original investment or its gains and may potentially reduce the Fund’s Net Asset Value per Share as well as the capital available for future investment.
- The Fund may suffer from losses or delays when recovering the securities lent out. This may potentially affect its ability to meet payment and redemption obligations. Collateral shortfalls due to inaccurate pricing or change of value of securities lent, may cause significant losses to the Fund.
KOSPI 200 ETF: A Haven from Developed Market Debt Crisis
The Global X KOSPI 200 ETF (3408 HK) is largely driven by a handful of semiconductor stocks. As we noted in a research article last week (link), the ETF’s valuation appeal has reached an unprecedented level following the recent sharp decline in these semiconductor stocks.
However, beyond this immediate price appeal lies another powerful investment point: South Korea’s robust macroeconomic fundamentals. The country is currently experiencing a meaningful turnaround in both its fiscal deficit-to-GDP ratio and its external balance. While these macroeconomic indicators are often overlooked during quieter times, they serve as critical analytical lenses today as concerns over a global fiscal crisis loom large.
Developed Markets’ Sovereign Debt Trap: Spending Cuts or Structural Inflation
In stark contrast, major advanced economies like France, the UK, the US and Japan are currently grappling with severe sovereign debt crises. For example, the root cause of the recent massive protests and political turmoil in France is the public’s refusal to accept government spending cuts aimed at reining in ballooning national debt.
The UK, the US, and Japan face a similar dilemma. Choosing austerity and tax hikes to reduce debt is highly likely to trigger social conflict and economic slowdowns. Conversely, maintaining current spending levels would require monetary expansion, fuelling inflation and putting immense downward pressure on their currencies.
[Table] Government Debt-to-GDP Ratio Comparison
| Country | 2026 Government Debt to GDP (%) |
|---|---|
| Japan | 204% |
| Italy | 138% |
| US | 126% |
| France | 118% |
| Canada | 111% |
| Advanced Economies Avg. | 108% |
| United Kingdom | 104% |
| Germany | 65% |
| South Korea | 46% |
(Source) IMF Fiscal Monitor, 2026
South Korea’s Robust Fiscal Health and Macro Resilience
The Korean economy remains decoupled from these developed-market fiscal risks. Because its fiscal deficit has been contained at a low level, the government retains the policy ammunition to deploy fiscal stimulus without the burden of excessive debt if an economic downturn materializes in the foreseeable future. Unlike most advanced economies, South Korea faces no structural pressure to pursue monetary expansion in order to inflate away its sovereign debt; therefore, the Korean won is likely to remain stable. As volatility in global asset markets rises, South Korea’s sound fiscal health and the resulting defensive resilience of the KOSPI 200 will become increasingly prominent.
Let’s take a closer look at its national debt. South Korea has historically managed its fiscal balance with greater discipline than most global peers, and the recent AI-driven semiconductor super-cycle has provided an exceptional boost to this fiscal soundness. For instance, corporate tax revenues, which stood at approximately 85 trillion KRW in 2025, are projected to surpass 200 trillion KRW based on corporate earnings in 2026.
[Table] South Korea’s GDP and Government Debt Ratio Trend
| Year | Nominal GDP (Trillion USD) |
Government Debt (Billion USD) |
Debt-to-GDP Ratio (%) |
|---|---|---|---|
| 2022 | 1.7 | 827 | 49% |
| 2023 | 1.7 | 868 | 51% |
| 2024 | 1.9 | 932 | 50% |
| 2025 | 1.9 | 977 | 52% |
| 2026e | 2.2 | 1,035 | 46% |
| 2027e | 2.5 | 1,209 | 48% |
| 2028e | 2.7 | 1,295 | 48% |
(Source) Bank of Korea, IMF World Economic Outlook
While the debt-to-GDP ratios of major developed nations like the US (126%), Japan (204%), and the UK and France (both over 100%) are approaching critical levels, Korea has capitalized on its semiconductor tax windfall to lower its national debt ratio from 51% in 2025 down to 48% in 2027e.
Global X KOSPI 200 ETF (3408 HK): Undervalued in Many Aspects
Because its sovereign debt is tightly managed at low levels, the government has a powerful counter-cyclical tool to support the economy effectively when needed. With no mandate to induce inflation via aggressive money printing, macro risks such as hyperinflation or extreme currency depreciation are non-factors when investing in Global X KOSPI 200 ETF (3408 HK).
Admittedly, the Korean market is not entirely without risks. A correction remains possible if the semiconductor cycle peaks and prices turn downward. However, as reiterated in our previous research, the current valuation of the KOSPI 200 has already priced in substantial fears of a semiconductor down-cycle while overlooking the country’s superior macroeconomic health. The KOSPI 200 currently trades at a P/E multiple of just 5.4x, a record low both historically and relative to global markets.
[Chart] KOSPI 200 Index FY1 PER
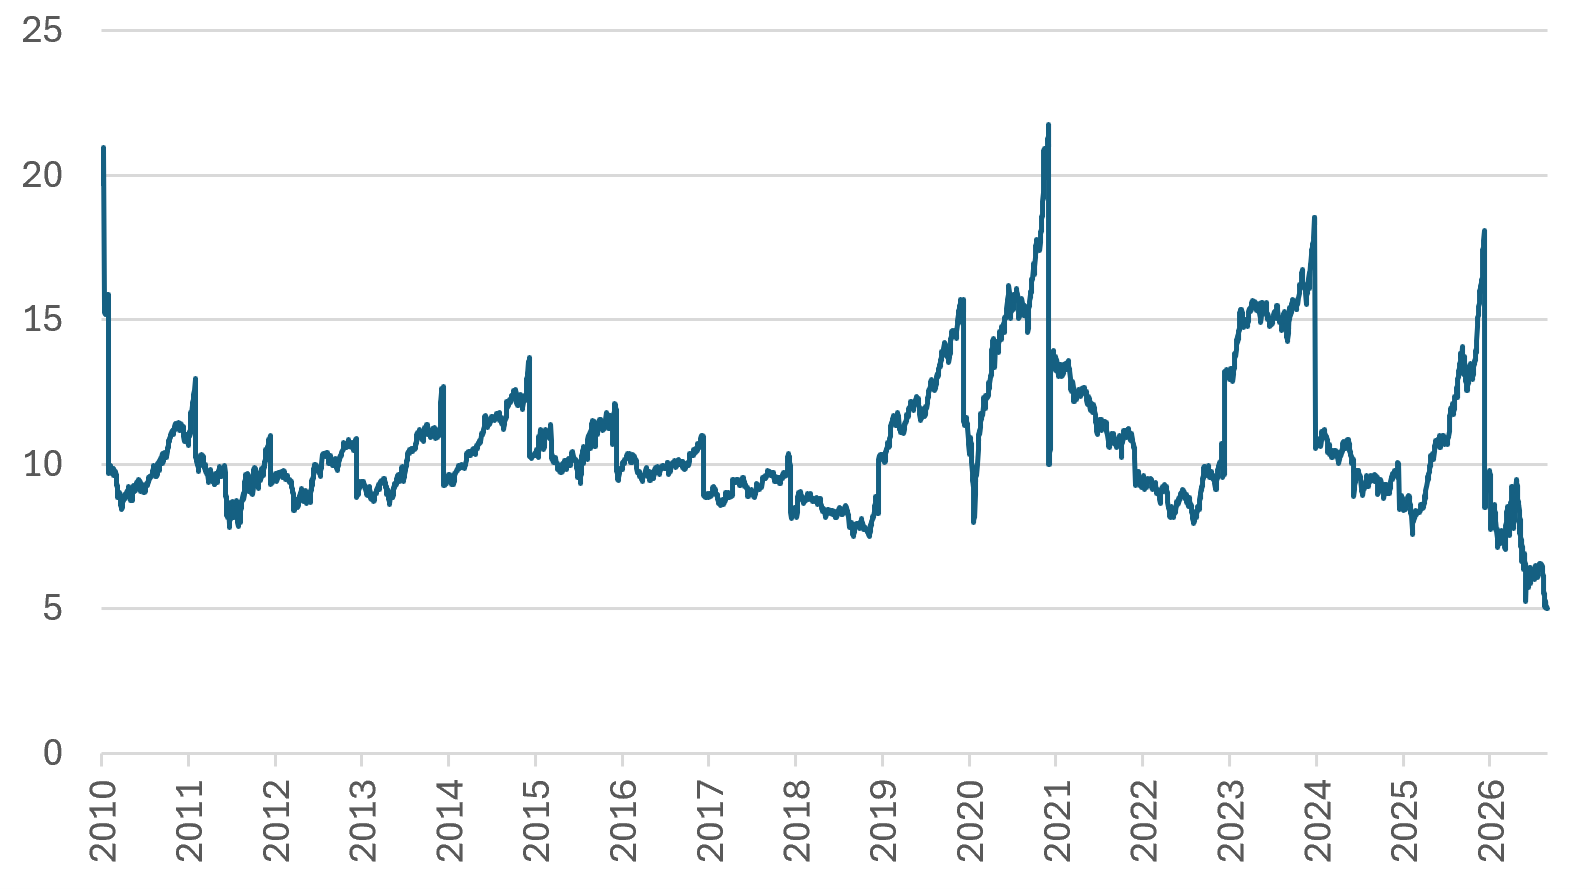
(Source) Bloomberg, Oct 2026
(Note) FY1 stands for the current fiscal year in which the company is operating
[Table] FY1 P/E Ratio of Major Global Indexes, 2026
| Major Equity Index | FY1 PER |
|---|---|
| KOSPI 200 | 5.4 |
| FTSE 100 (UK) | 12.8 |
| CAC 40 (France) | 13.7 |
| S&P 500 (US) | 21.2 |
| MSCI World Index | 17.8 |
| MSCI Emerging Index | 10.5 |
(Source) Bloomberg, Oct 2026
(Note) FY1 stands for the current fiscal year in which the company is operating.



 (852)3555 5888

 Leave Us A Note