Important Information
Investors should not base investment decisions on this website alone. Please refer to the Prospectus for details including the product features and the risk factors. Investment involves risks. Past performance is not indicative of future performance. There is no guarantee of the repayment of the principal. Investors should note:
- The investment objective of the Global X KOSPI 200 ETF (the “Fund”) is to provide investment results that, before fees and expenses, closely correspond to the performance of the KOSPI 200 Index.
- The Fund is exposed to concentration risk by tracking a specific region or country (South Korea). The value of the Fund may be more susceptible to adverse economic, political, policy, foreign exchange, liquidity, tax, legal or regulatory events affecting the South Korean market.
- The Korean market is subject to high volatility as a result of high retail trading participation, as well as sudden regulatory shifts and shifts in market sentiment. Trading in the Korean market is also subject to circuit breakers and daily price limits.
- The underlying index of the Fund is heavily concentrated in its top two constituents (i.e. Samsung Electronics Co., Ltd. and SK Hynix Inc., which may account for more than 50% of this product’s Net Asset Value) which are of the same sector (i.e. the electronics and technology hardware industry, focusing on the semiconductor business), making the Fund potentially more volatile than a fund with a diversified portfolio.
- The constituents of the Index include large- or mega-capitalisation companies, which may be subject to slower growth during times of economic expansion and may struggle with flexibility to respond quickly to disruptions and changes in trends.
- The base currency of the Fund is KRW but the trading currency of the Fund is in HKD and USD. The NAV of the Fund and its performance may be affected by fluctuations in the exchange rates between these currencies and the base currency and by changes in exchange rate controls.
- The trading price of the Fund’s unit on the SEHK is driven by secondary market trading factors, which may lead to a substantial premium or discount to the Fund’s net asset value.
- The Manager may at its discretion pay dividends out of the capital of the Fund. Distributions paid out of capital, represent a return of an investor’s original investment or its gains and may potentially reduce the Fund’s Net Asset Value per Share as well as the capital available for future investment.
- The Fund may suffer from losses or delays when recovering the securities lent out. This may potentially affect its ability to meet payment and redemption obligations. Collateral shortfalls due to inaccurate pricing or change of value of securities lent, may cause significant losses to the Fund.
Investor FAQ: Global X KOSPI 200 ETF
Overview
Q: Can you give us a quick and simple summary of what Global X KOSPI 200 ETF (3408 HK) is and how it works?
A: It tracks the performance of the KOSPI 200 Index, capturing the top 200 large-cap companies listed in the Korean market. It is worth noting that the index is highly IT-heavy; its two largest semiconductor constituents, Samsung Electronics and SK Hynix, comprise roughly 60% of the entire index weight.
[Table] KOSPI 200 Sector Mix
| Sector | Weight (%) | Key Constituents |
|---|---|---|
| IT | 66.1 | Samsung Electronics (34%), SK Hynix (27%), Samsung Electro-Mechanics. |
| Industrials | 12.8 | Samsung C&T, Hanwha Aerospace, Doosan Enerbility. |
| Financials | 7.9 | KB, Shinhan, Mirae Asset Securities |
| Consumer Discretionary | 4.4 | Hyundai Motor, Kia Motors |
| Other Sectors | 8.8 |
(Source) Factset, Global X Hong Kong, 30 Oct
On Korea Equity Market Correction
Q: Given the concentration in the IT sector, how do you assess the recent massive Korean market correction, which was more than 30% from the peak in June?
A: The October sell-off, particularly for Samsung and SK Hynix, was largely driven by anxiety over a potential conventional DRAM oversupply. It was triggered by recent technology roadmaps announced by China’s CXMT. The company announced the mass production of its fifth-generation DRAM platform, aiming to shrink memory nodes to 12 nm without EUV lithography equipment. Alongside this, it unveiled a pioneering 3D design cell architecture.
However, our research indicates that the market’s reaction is overdone. First, scaling a next-generation production line will take years, and it will come at a significantly higher cost curve than what the established Korean memory makers have. Second, running these advanced lines forces CXMT to cannibalize its own existing capacity. As a result, we project conventional DRAM volume growth, excluding HBM, to be capped at around 20% over the next two years.
[Chart] KOSPI 200 index performance
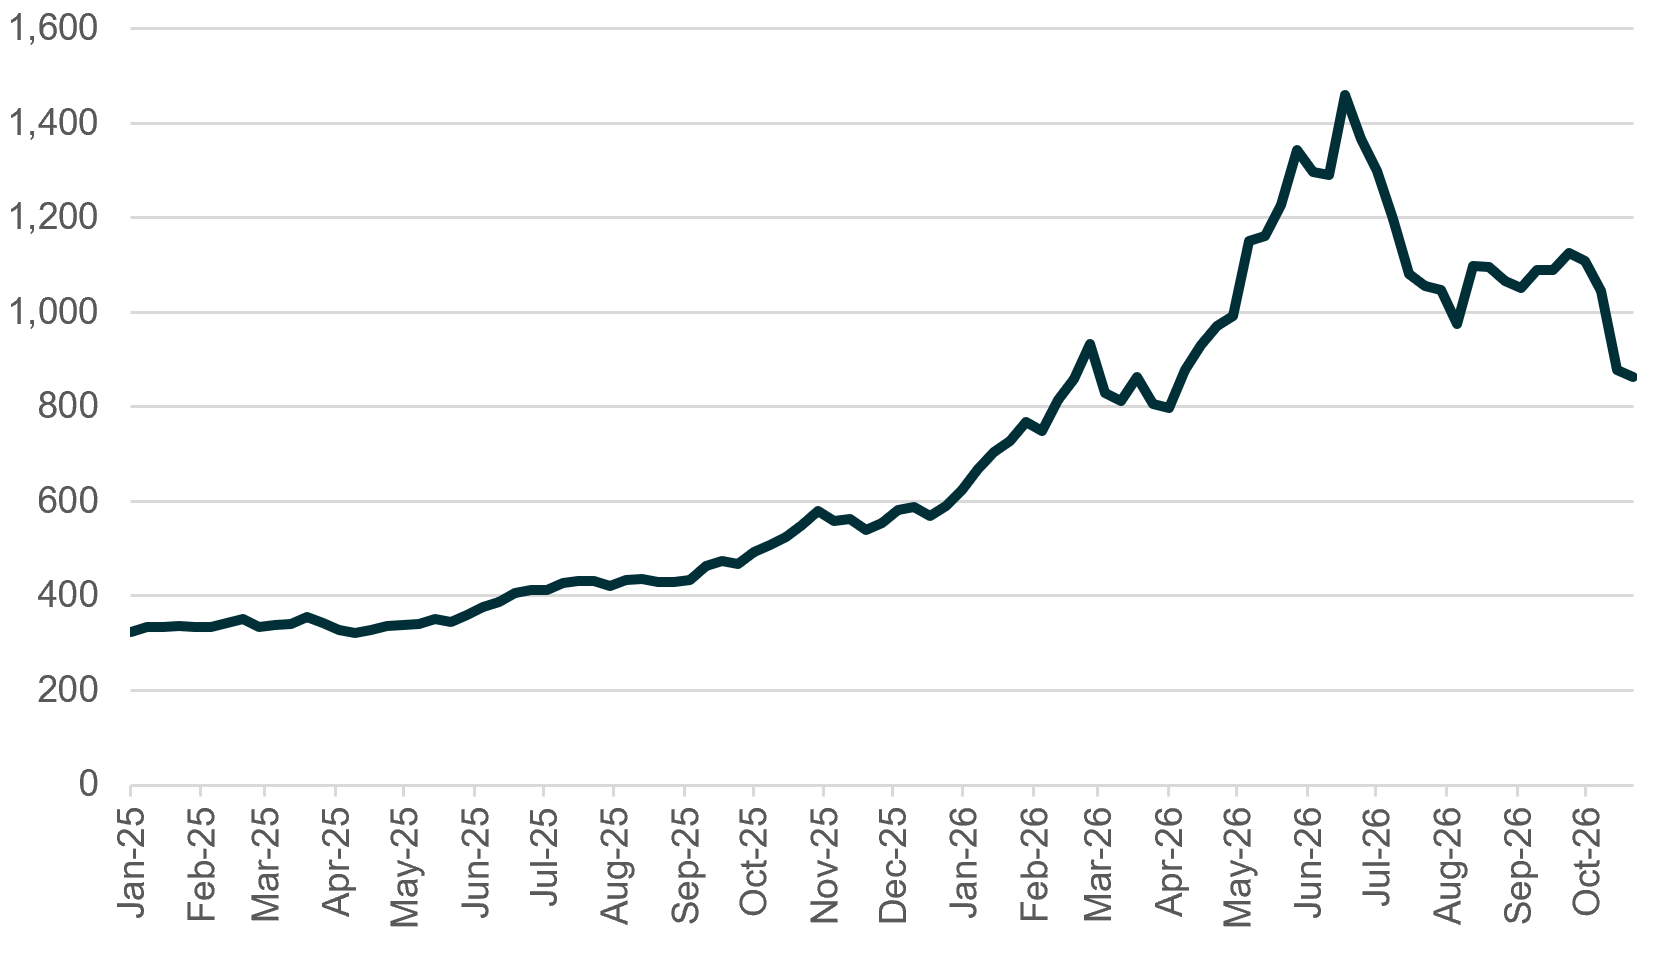
(Source) Factset, Global X Hong Kong, 30 Oct 2026.
Conventional DRAM Demand: Will AI Overpower Over-supply Fears?
Q: But conventional DRAM prices have already surged three times over the past year. Is there a legitimate fear that these current high prices will destroy underlying demand, leading to a severe price downturn?
A: That thesis was accurate in past cycles, when the primary demand drivers for conventional DRAM were PCs and smartphones bought by everyday consumers. They are naturally highly price sensitive.
Today, however, the demand driver for conventional DRAM is very different. The secular growth in AI inference is being spearheaded by hyperscalers, software enterprises, and cloud service providers. They are well-capitalized and willing to absorb higher DRAM costs because hardware capacity directly dictates their computing capability.
Furthermore, emerging secular segments like robotics, AI edge devices, and autonomous driving are still in their infancy; any minor price consolidation in DRAM would immediately unlock massive, price-elastic demand from these new sectors, effectively creating a structural floor for the market.
KOSPI 200 Valuation & Margin of Safety Amid Market Correction
Q: Even so, forecasting is never easy. If an unexpected demand shortfall for either conventional DRAM or HBM does trigger a supply glut, where is the fundamental bottom?
A: Even under a bear-case scenario, the KOSPI 200 index appears to offer a strong margin of safety at current levels. The two leading memory stocks are trading at incredibly suppressed valuations.
By aggressively discounting the index today, the market is pricing in a catastrophic collapse in DRAM pricing for 2028—a timeline that is simply too far out to forecast with such pessimistic certainty. Currently, the KOSPI 200’s forward P/E ratio has compressed to a record low of 5x. To put that into a global perspective, the S&P 500 trades at roughly 21x, and the MSCI Emerging Markets Index sits at 10x. Furthermore, this multiple represents a historic valuation anomaly for the South Korean market.
[Chart] KOSPI 200 Index FY1 PER
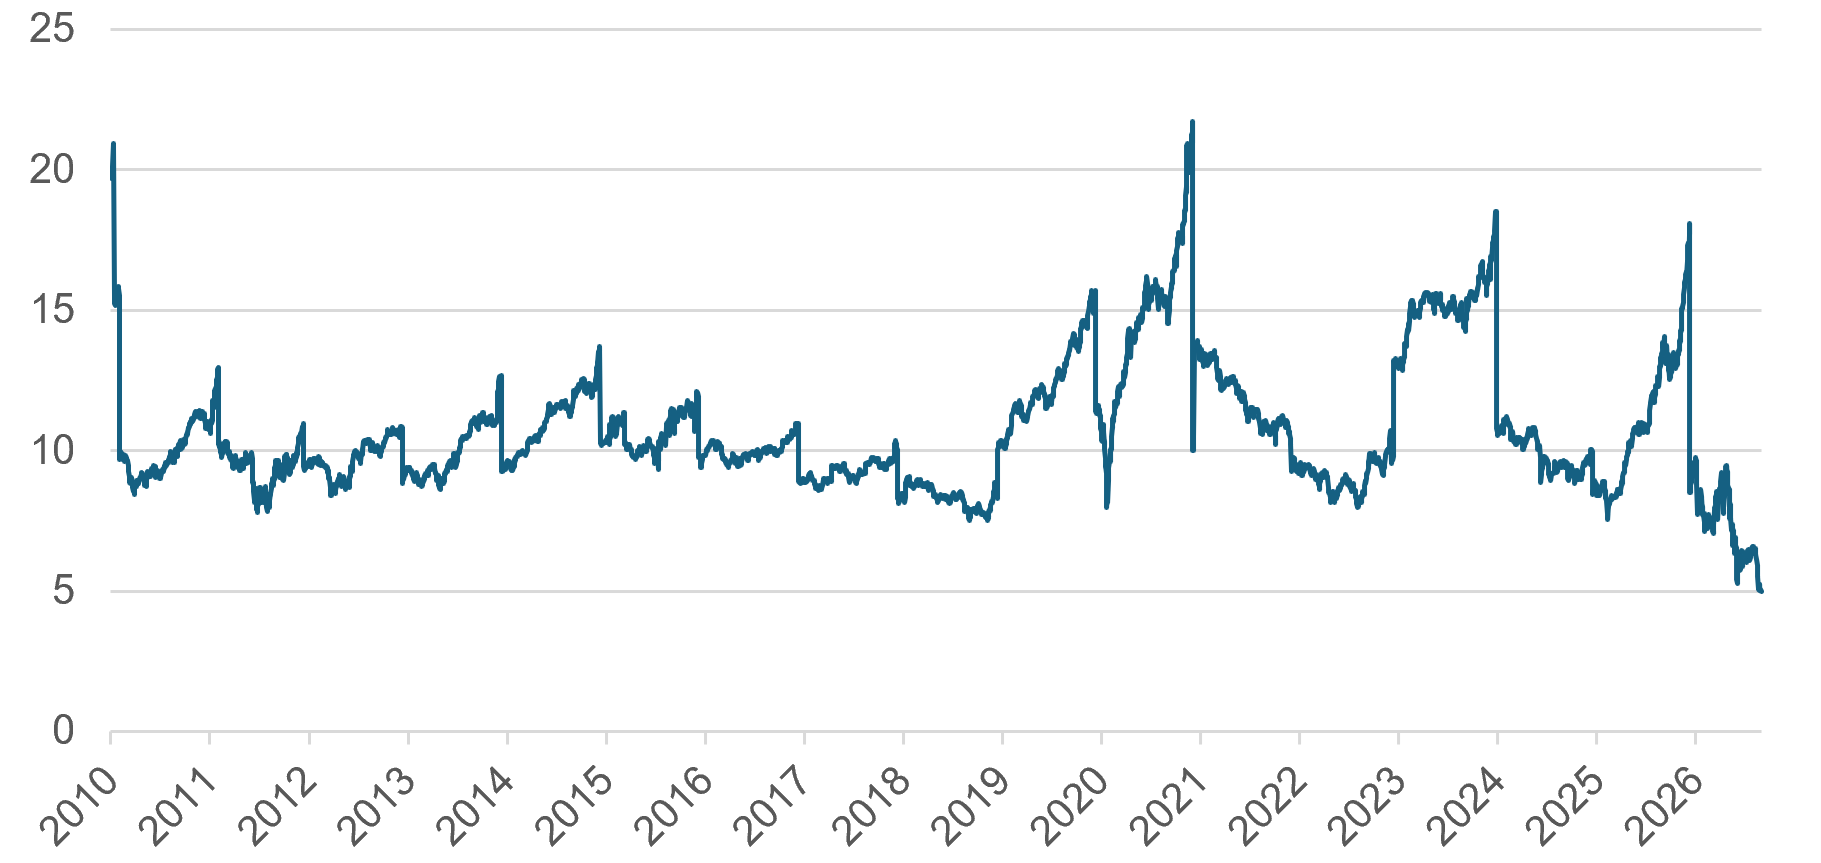
(Source) Bloomberg, Oct 2026
(Note) FY1 stands for the current fiscal year that the company is currently operating in
South Korea’s Fiscal Health vs. Advanced Economies’ Sovereign Debt Risk
Q: That is a stark valuation gap. But looking at the broader picture, shouldn’t non-Korean investors be concerned about South Korea’s macro risks, particularly currency volatility, given its historical experience?
A: That is another legacy bias that misses how much South Korea’s macro-prudential framework has improved.
Look at the government debt: recently, the IMF slashed South Korea’s projected general government debt-to-GDP ratio down to a remarkably lean 46%. In stark contrast, according to the same report, major advanced economies like France, the UK, and the US have government debt exceeding 100% of GDP. Japan presents an even more severe case, with debt exceeding 200%.
These developed markets are the ones facing a genuine sovereign debt crisis, as evidenced by severe fiscal strains and social friction in France in 2026. Advanced economies now face a serious policy dilemma. Implementing austerity threatens to trigger economic slowdowns and social conflict. Conversely, maintaining fiscal spending requires continuous monetary expansion, which fuels structural inflation and exerts pressure on currencies.
[Table] South Korea’s GDP, Government Debt Ratio Trend
| Year | Nominal GDP (Trillion USD) |
Government Debt (Billion USD) |
Debt-to-GDP Ratio (%) |
|---|---|---|---|
| 2022 | 1.7 | 827 | 49% |
| 2023 | 1.7 | 868 | 51% |
| 2024 | 1.9 | 932 | 50% |
| 2025 | 1.9 | 977 | 52% |
| 2026e | 2.2 | 1,035 | 46% |
| 2027e | 2.5 | 1,209 | 48% |
| 2028e | 2.7 | 1,295 | 48% |
(Source) Bank of Korea, IMF World Economic Outlook
Corporate Governance Reform & Korean Shareholder Return Trends
Q: The Korean equity market has been discounted due to corporate governance issues. Major shareholders were reluctant to share profits with minority shareholders. Could you please explain the recent trends?
A: You are right. That was a valid concern, but there is now a structural shift driven by societal expectations and explicitly championed by the government to push for higher shareholder returns. The total shareholder return relative to net profit has significantly improved from the low 20% range ten years ago to more than 40% now. Of course, this is still far from the US market, where roughly 80% of profit is distributed, but the 40% figure is now close to that of advanced European nations.
[Chart] KOSPI 200 Total Shareholder Return / net profit
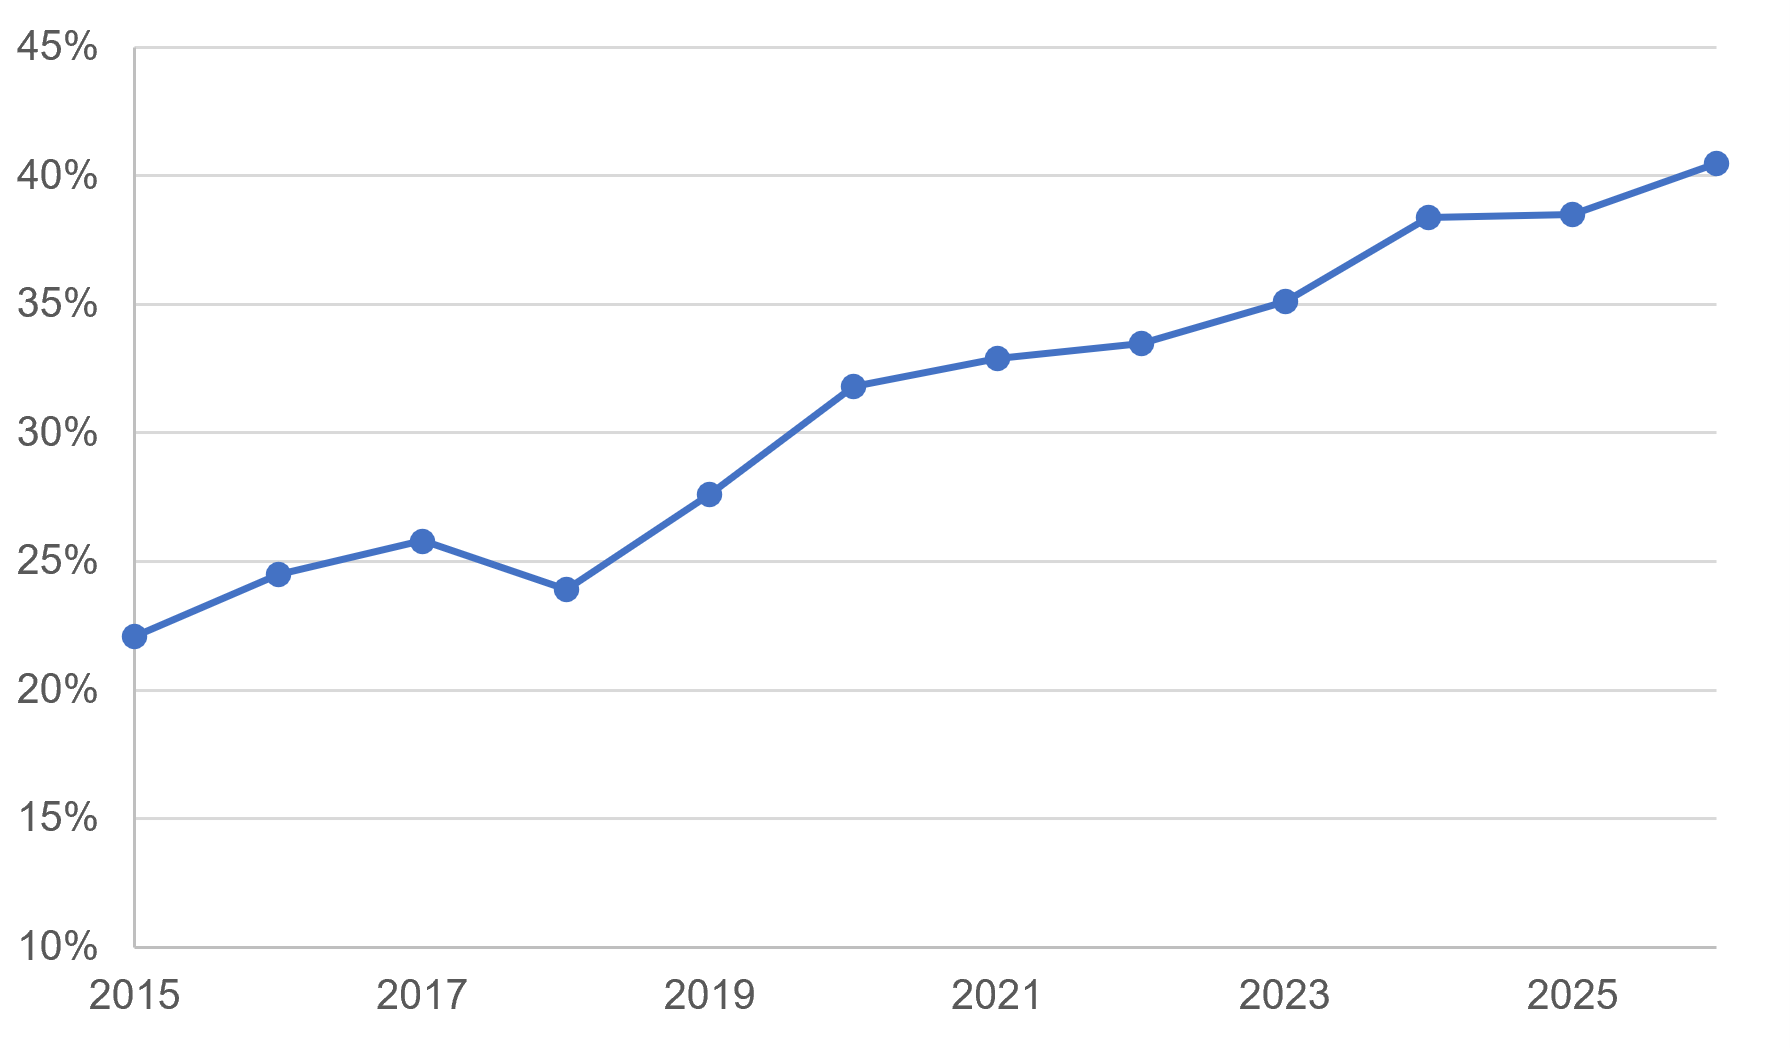
(Source) BOK, Bloomberg, 2026
Market Mispricing: Why Global Investors Overlook Korean Equities
Q: If the underlying macro fundamentals are this resilient compared to the West, why does this extreme valuation discount persist?
A: Historically, global investors categorized Korea as a cyclical emerging market with less shareholder-friendly corporate governance. However, in a global economy where traditional developed nations remain caught in a sovereign debt trap, South Korea’s prudent macro indicators stand out. Furthermore, while domestic corporate governance has improved significantly, global investors still largely underrecognize this progress.
Global X KOSPI 200 ETF (3408 HK) Top 10 holdings
| Name | Weight (%) |
|---|---|
| SAMSUNG ELECTRONICS | 34.1 |
| SK HYNIX INC | 27.3 |
| SK SQUARE | 2.7 |
| SAMSUNG ELECTRO-MECHANICS | 2.2 |
| KB FINANCIAL GROUP INC | 1.5 |
| HYUNDAI MOTOR | 1.2 |
| SHINHAN FINANCIAL GROUP | 1.1 |
| SAMSUNG SDI | 1.0 |
| SAMSUNG C&T CORP | 1.0 |
| CELLTRION INC | 0.9 |
(Source) Factset, Global X Hong Kong, 30 Oct 2026



 (852)3555 5888

 Leave Us A Note