China Clean Energy Industry Review and Outlook
Section 1 – Solar Industry 2021 Review
Market was quite bullish on demand at the beginning of last year. Over 150GW solar power was installed globally, implying mid-teen year-over-year growth, though worries on polysilicon prices hike carried through the whole year.1 Solar product prices began to rise in September after a slight slowdown in the low season of summer. Mono-polysilicon prices, which stood at Rmb80/kg at the beginning of 2021, jumped from Rmb200/kg to nearly Rmb270/kg in the last three months.2 Wafer (M6) prices also rose from Rmb3.22/pc to Rmb4.7/pc to Rmb5.75/pc in the same period and large size wafer replacement was accelerating.3 Solar cell and module margins stayed at a breakeven point for the whole year, worst in Q2 and weakly improved in Q3 and Q4(E) thanks to utilization rate decline. Price hikes driven by polysilicon shortage were the eyecatcher through the whole year. High module prices were partially passed to overseas markets and domestic distributed generation markets for market-oriented electricity prices or higher project return. Solar power installations in India, the US and Europe were fast growing. Domestic solar farm projects were negatively affected. Wafer producers were the first to largely cut prices at the end of the year, resulting in module prices slightly falling to Rmb2 per watt to encourage installation demand, but polysilicon prices had not declined yet.4
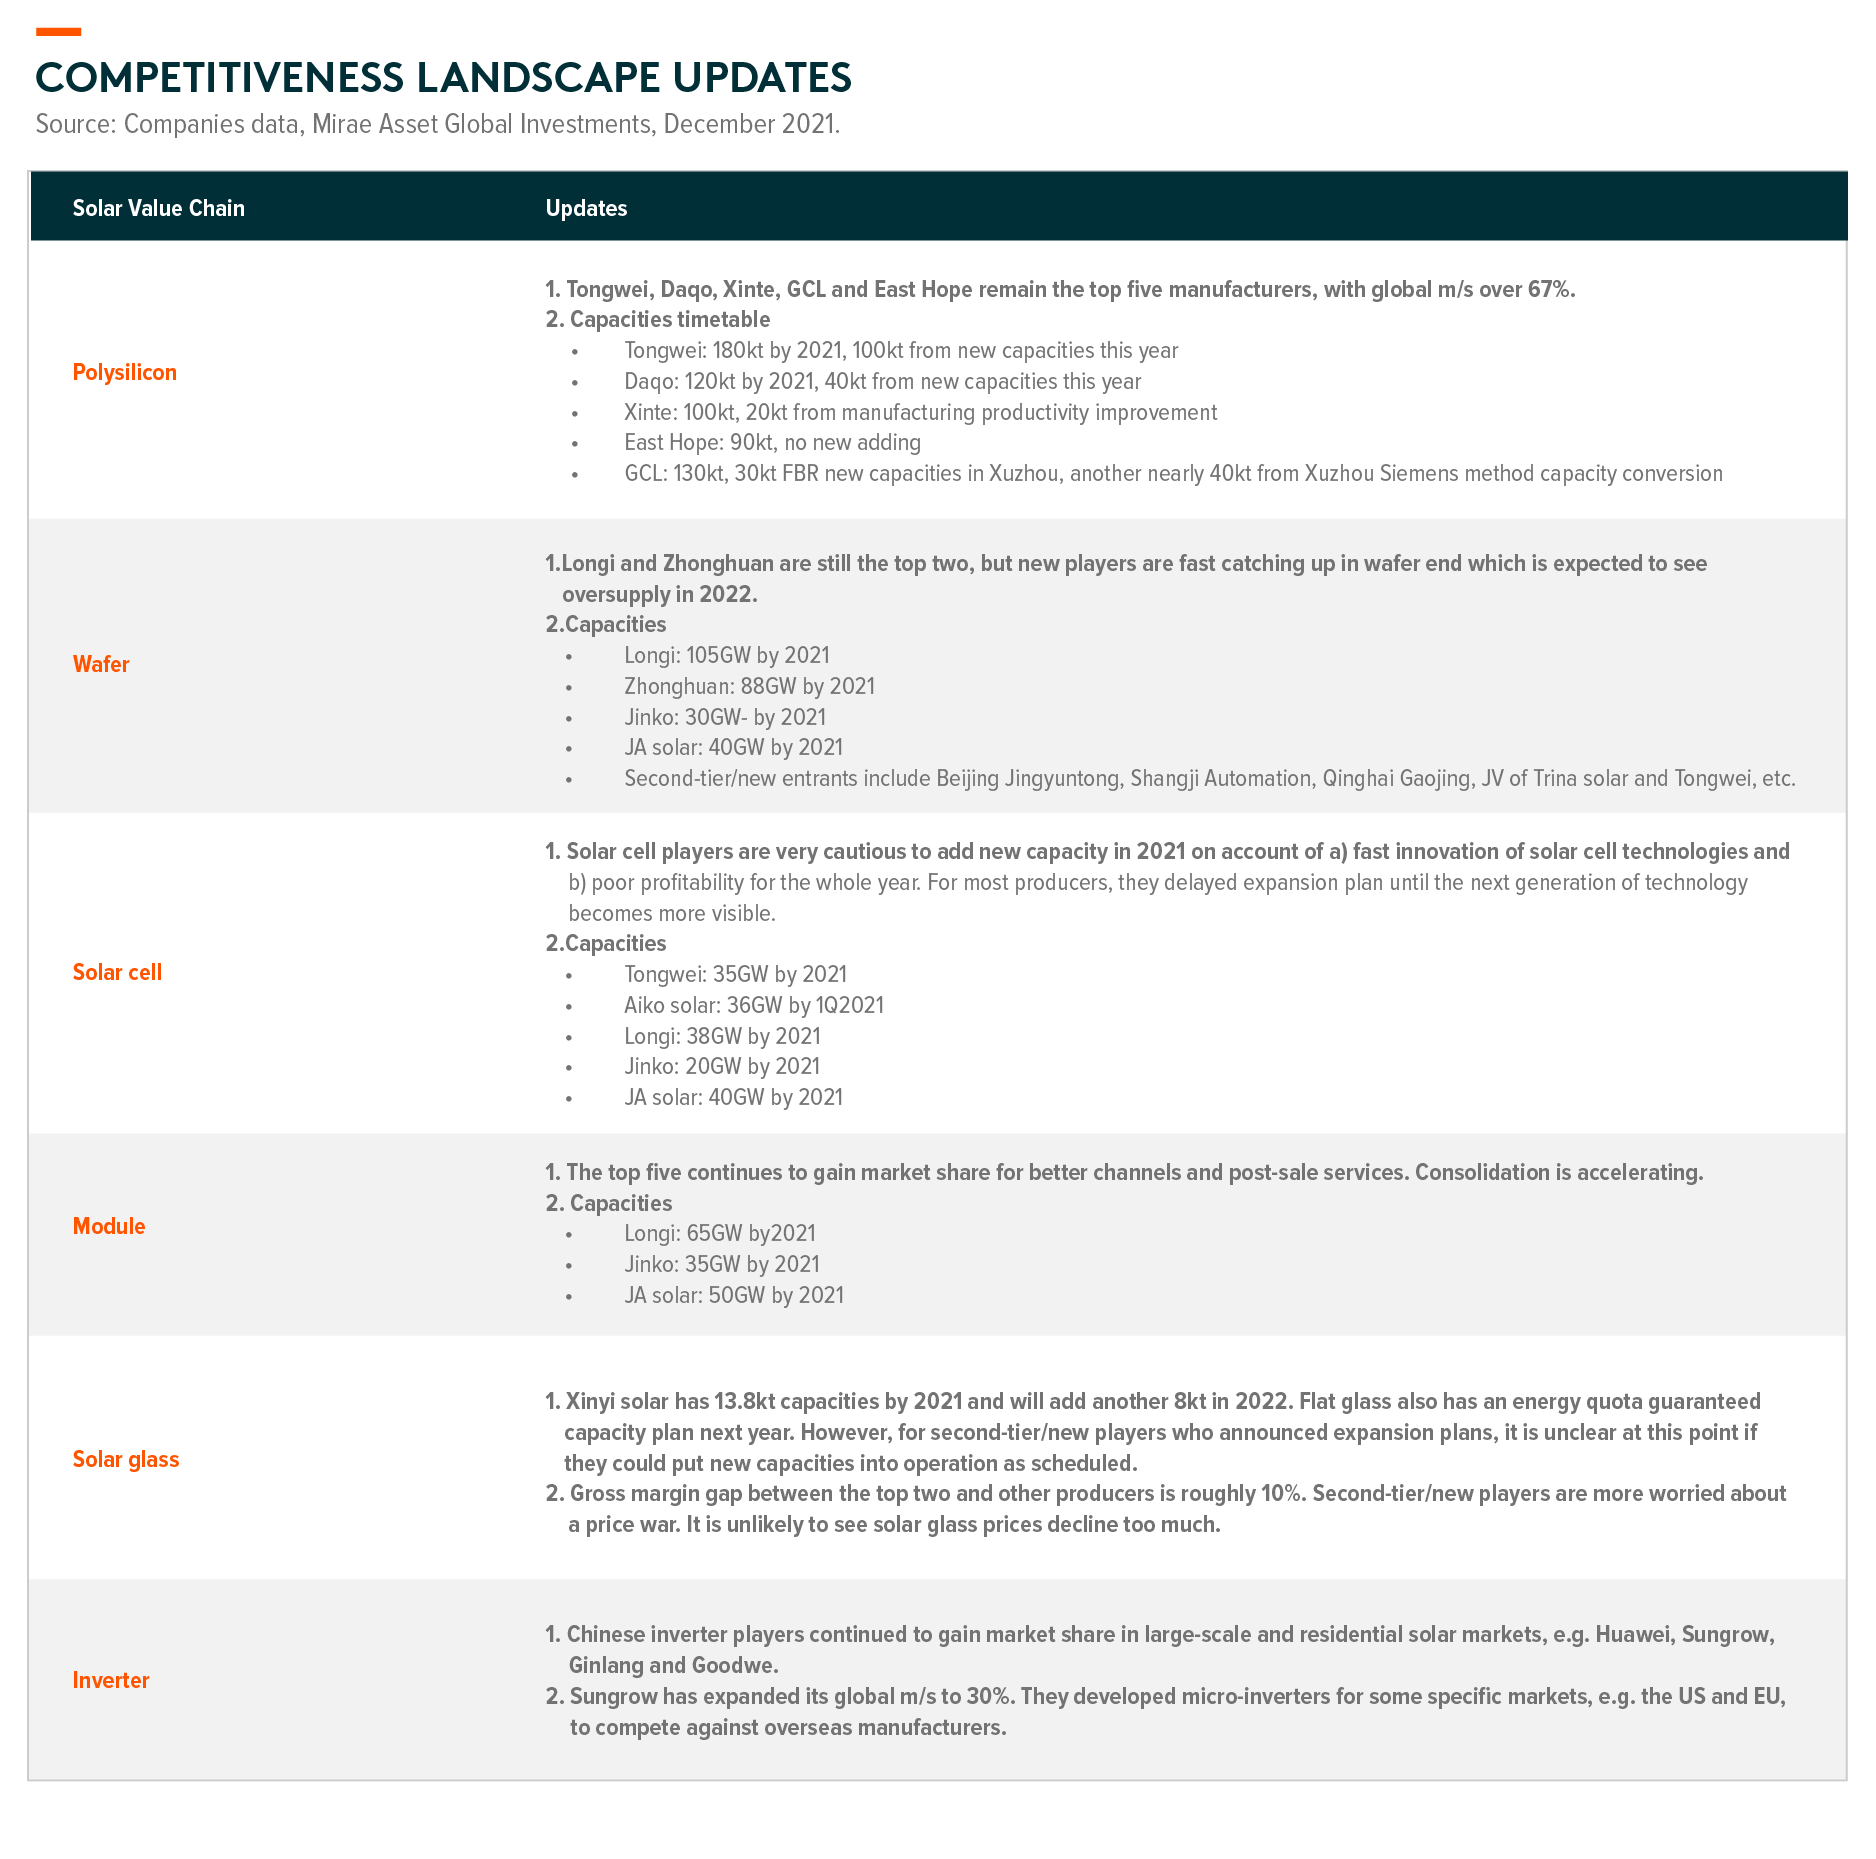
Wafer size and solar cell technologies are two vital innovations in 2021. Large size wafer penetration was accelerating, much faster than previously expected on account of polysilicon cost saving. M6 and below products lost their market share to less than 50% by the end of the year, and this number is expected to be even lower in 2022.5 Zhonghuan Semiconductor, and some second-tier/new players (Qinghai Gaojing, Trina Solar, etc.), were adding G12 wafer capacities, while Longi and JA Solar continued to focus on M10. One reason why Longi and JA Solar chose M10 was they added a lot of new M6 wafer capacities in the last two year, which could be upgraded to M10. Cash collection cycle for equipment investment is around two to three years. We were concerned that Longi would not have access to G12 wafer technologies, but Longi announced on October 15 they had G12 technologies. Meanwhile, Tongwei confirmed switching their new production lines of G12 solar cell in Sichuan to M10 for better profitability. These moves have increased market confidence in Longi’s long term competitiveness. Downstream cell, module and solar glass capacities are not enough to support a large market share of G12 at this point. Zhonghuan, the key advocator of G12 products, guided they will have over 110GW G12 capacities by 2023.6 We expect fierce competition in wafer end in 2022.
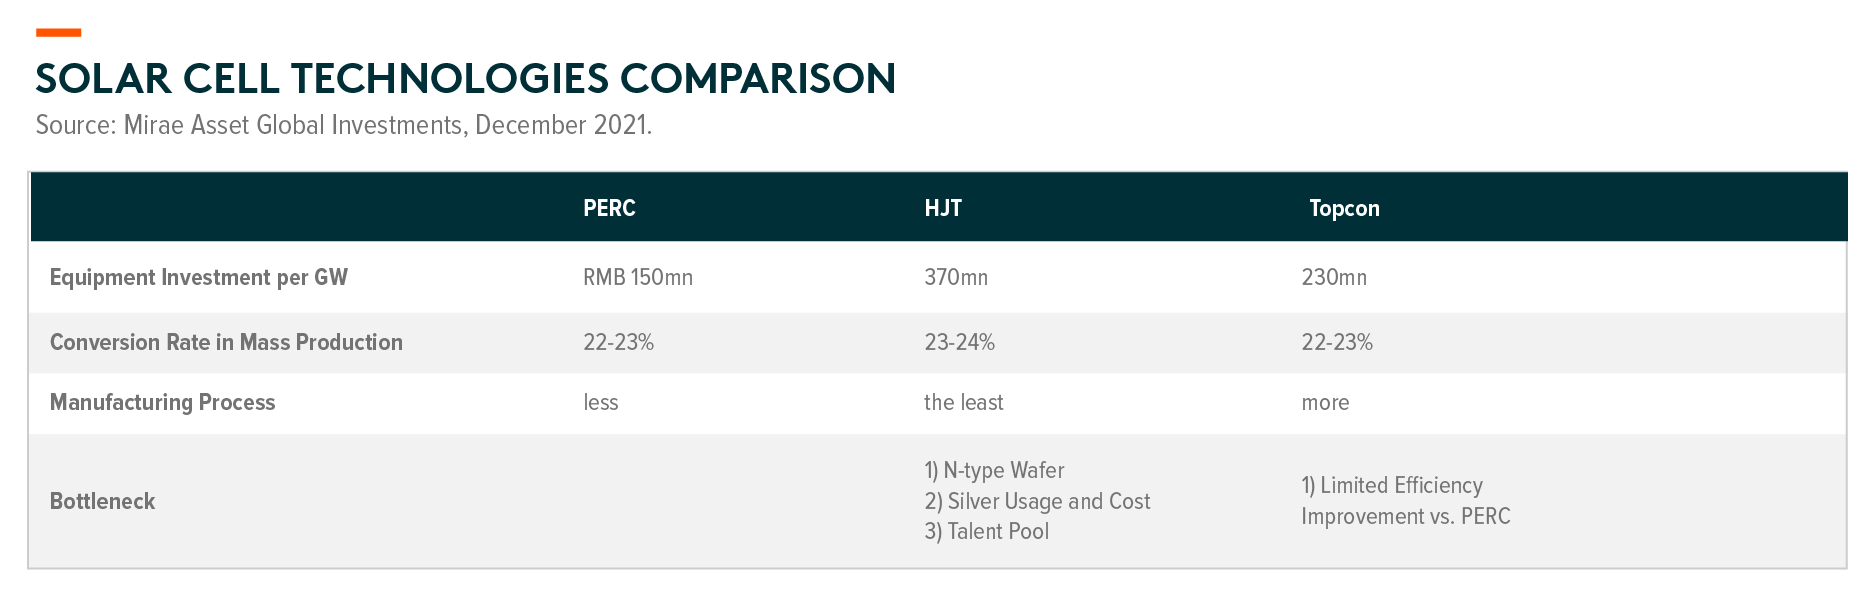
Regarding solar cell technologies, we believe massive production based on new tech will not come out until 2023. HJT and Topcon are two main possible solutions to replace PERC. HJT equipment investment per GW is Rmb370mn by 1H21 vs PERC at 150mn and Topcon at 230mn.7 It is expected to drop to Rmb250~300mn in one or two years. Experts expect 90% yield, 25% conversion rate and 2GW massive production line will make HJT cost comparable to PERC. That means the cost difference within Rmb0.2/w is cost competitive. Currently, bottleneck locates in: 1) N-type wafer costs 8% higher than P-type and the effective capacity is very limited. 2) Silver is expensive in solar cell making process. The industry is working on reducing the usage of silver or entirely replacing silver by copper. 3) HJT talent shortage. Equipment makers provide one-stop technology package to solar cell makers (e.g. Tongwei and other small players) with 10% service fee annually. For HJT solar cell manufacturing, Tongwei has 1GW HJT production line put into operation recently. Anhui HuaSun has 750MW HJT in mass production. Longi also added 1GW in early September. Some other players have planned HJT capacities but are yet to put them into operation. In terms of Topcon, Longi has 1GW production line. Jinko and JA solar mentioned their strategies in Topcon but have no actions so far. In terms of equipment, Suzhou Maxwell is a leader in HJT equipment manufacturing and is able to provide almost the whole production line. Lixiang Energy, a private company, benefits from its close relationship with governmental research institutions and is catching up very fast. GS Solar and Shenzhen S. C New Energy are able to provide some parts of HJT production line, but lagging in conversion rate and yield. Topcon equipment is based on PERC equipment with changes and adjustment. Hence, the current solar cell equipment makers have fewer difficulties in terms of technology.
Section 2 – Solar Industry 2022 Market Outlook
We have no doubt on the long-term trend of solar materials cost decline which will ultimately make solar energy cost competitive. However, it is common to see price fluctuations of some solar products due to short-term supply and demand mismatch. Solar farm investors partially tolerated elevated module prices and IRR decline in 2021, but after module prices exceeded Rmb2/w8, even political KPIs from central government failed to work.
Heading into 2022, the market expects global installation to reach 200GW, with China, India, the US, Europe, South America and Middle East as the fastest growing regions (Exhibit 1). Incremental polysilicon capacities in 2022 could provide up to 70GW of new supplies.9 Leading wafer makers started to cut prices and give up some margins to encourage demand at the end of 2021, followed by solar cell, module and finally polysilicon providers. This will in some degrees accelerate the installation. With more polysilicon producers releasing their new capacities, polysilicon prices are likely drop, providing more profitability room for downstream players. We do not expect a sharp decline of polysilicon prices provided that supply and demand could be still in tight balance in 2022, especially coupled with delayed projects from 2021. Competition in wafer end could be fiercer with the vast of new capacities. Solar glass segment is in a better risk and reward position, with products prices close to the bottom. As module price tension gets released after wafer cost decline, pressure on further solar glass price cut is also eased. The solar inverter industry has the most visibility of double-digit growth and good competition landscape. Leading players are gaining market share from overseas market as well as domestic smaller players by expanding to more overseas markets and broadening product mix. The only concern is it could be priced in given valuation is the most expensive amongst solar value chain. Overall, valuation for solar material names has been corrected for a while owing to poor demand in the fourth quarter of 2021, worsening competition landscape. We believe solar names will become more attractive once installation demand picks up early this year.
Section 3 – Wind Industry 2021 Review
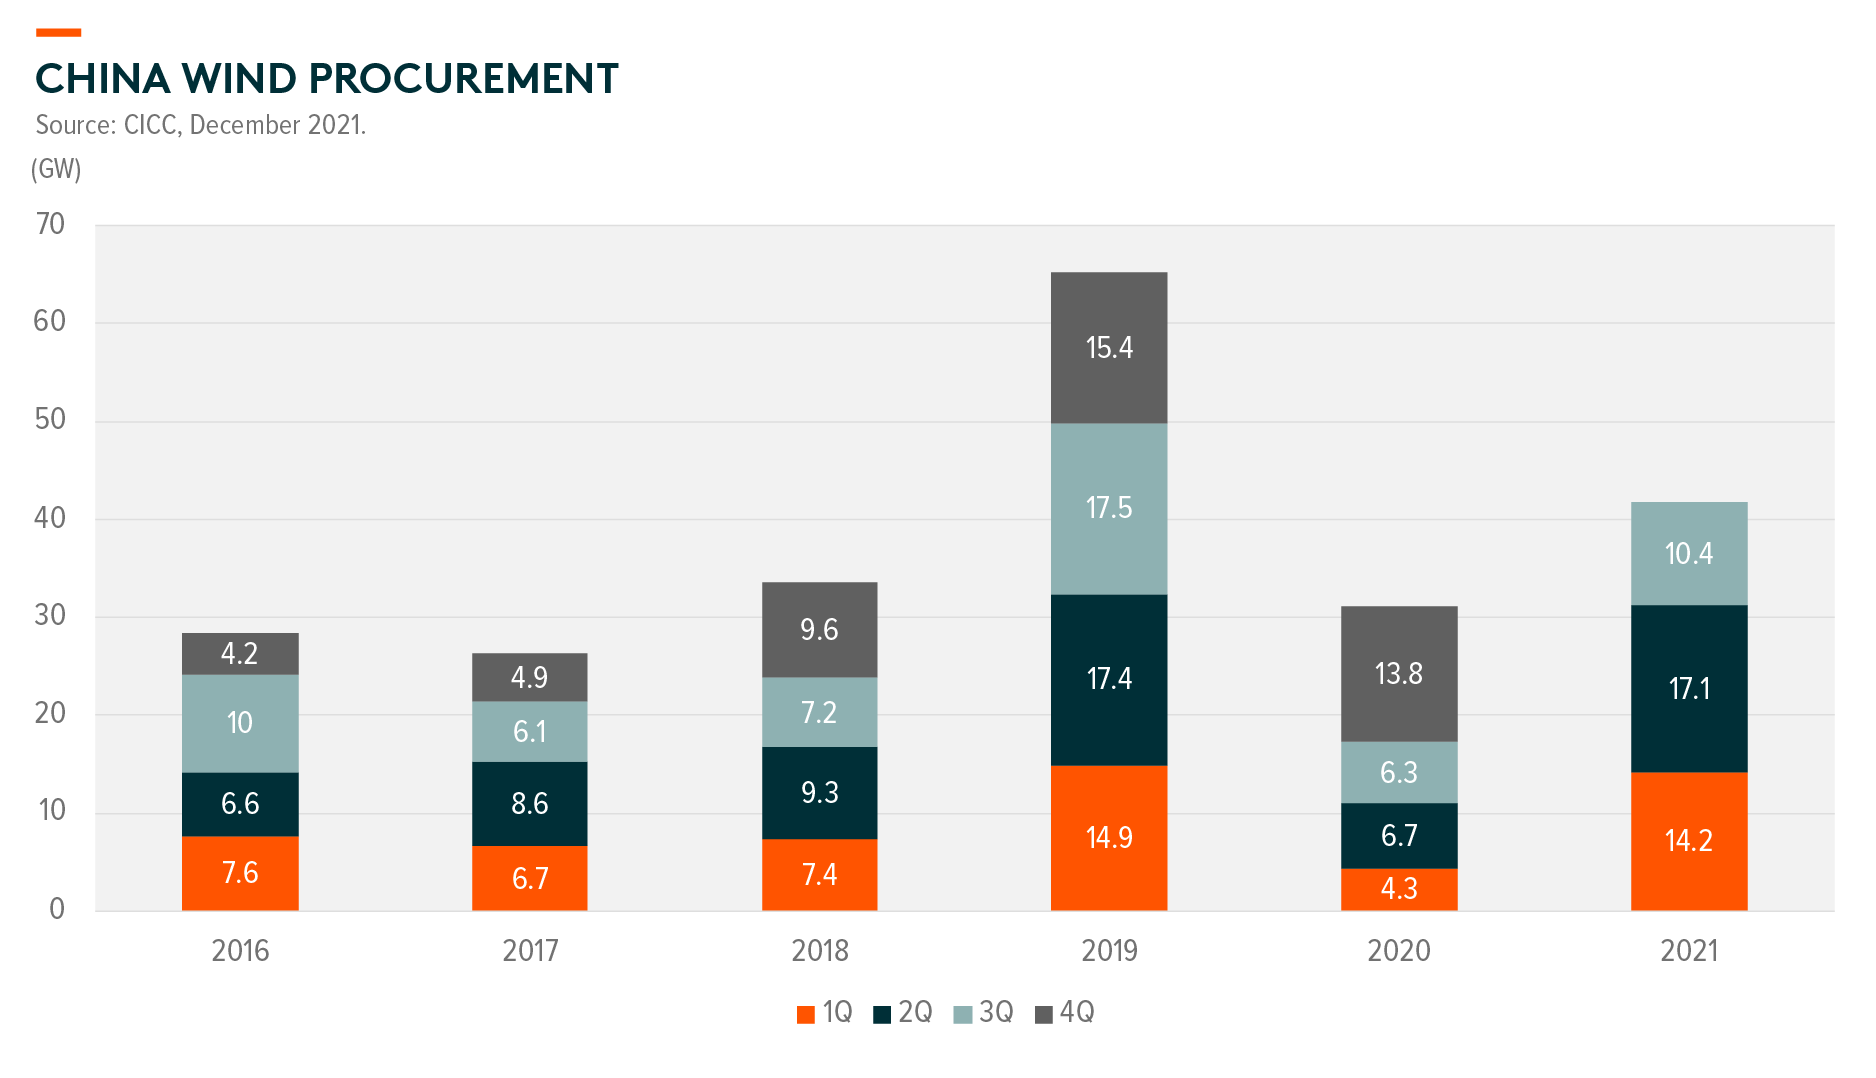
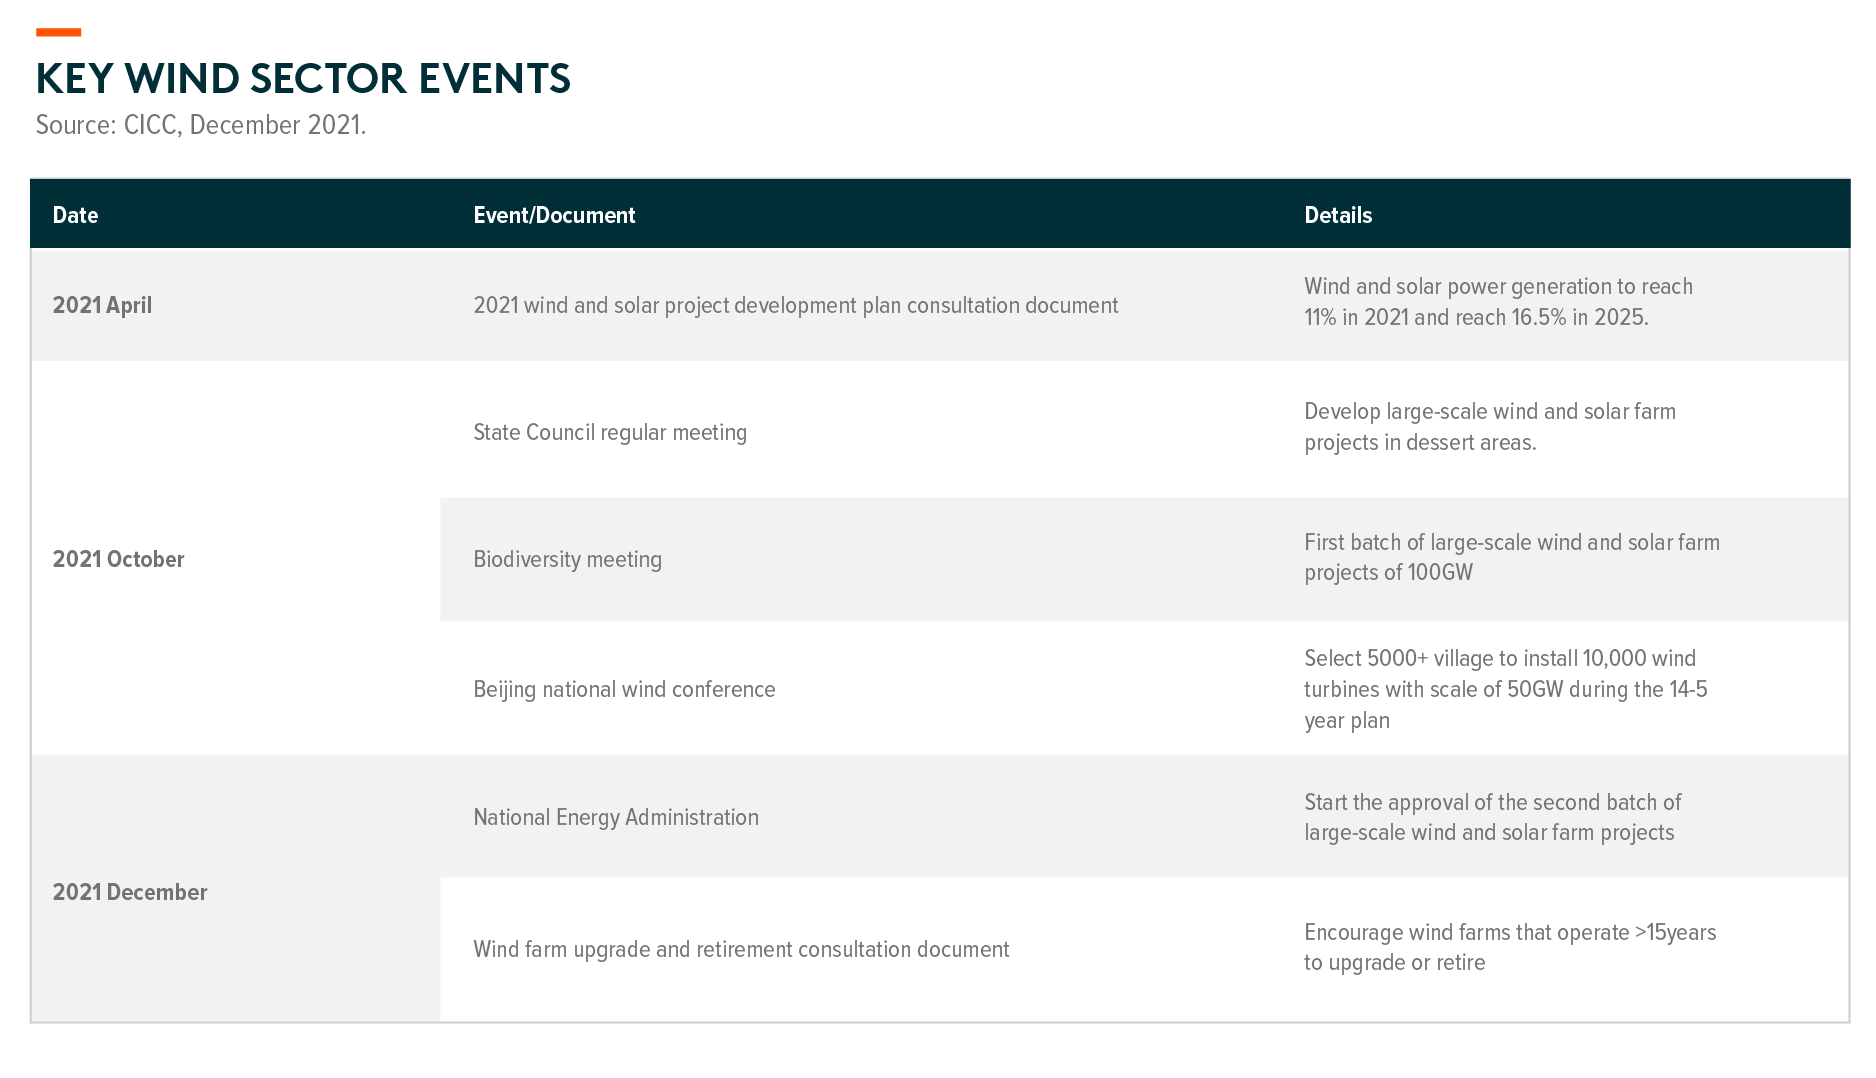
China’s wind power sector gathered investor attention in 2H21 mainly because 1) onshore wind project reached grid-parity; 2) onshore wind project procurement was stronger than expected; 3) continuous government support to renewables. We see government support a regular catalyst that drives the whole wind sector to rerate further, e.g. rural wind project development; large scale wind & solar project bases in desserts; repowering legacy wind turbine in good locations.
The offshore wind related component names (mainly the cable and wire companies) rerated sharply in November. The offshore wind project subsidy came to an end by end-2021. We expected a similar pattern vs. onshore wind projects, i.e. strong offshore wind installation in 2021 to meet the subsidy deadline, sharp tender price cut in 2022 and strong new order after successful cost cutting. What is different here is 1) some installations are expected to be delayed to 2022 due to shortages of marine installation capacity; 2) there are already some new offshore wind project procurement to be installed in 2022, meaning grid-parity could come faster than expected; and 3) some provinces are announcing aggressive total offshore wind installation targets.
Thanks to the COP26 (Climate Change Conference) meeting held in October 2021, we see global interest to look for ideas that are beneficiaries under the carbon neutral initiatives. We see healthy progress of wind farm installation globally ex-China. The high raw material inflation and high shipping costs are somewhat dragging the installation progress overseas because many components (bulky and heavy) are sourced from other countries. Weak wind resources in Europe earlier in 2021 also put increasing pressure on operators to balance power demand and supply. On the flip side, the increasing gas prices and hence power prices in Europe during 2H21 closer to winter time encouraged more aggressive investment in the power system.
Section 4 – Wind Industry 2022 Market Outlook
As levelized cost of energy (LCOE) further comes down for both onshore and offshore wind installation, we expect the price competition along the supply chain (component vs. wind generator vs. operators) to start materialize in 2022. Every player hopes for a lower LCOE and wants to pass the cost pressure to other parts of the value chains. The raw material cost inflation in 2021 made supply chain competition more intense. There are also growing concerns on the margin outlook and the pace of installations in 2022. We prefer to stay selective in 1H22 particularly in the component and wind generator sub-sectors.
We see a secular growth story for wind power in the next decade under the backdrop of carbon neutral initiatives. In Europe, we see wind generator leaders such as Vestas, General Electric and Siemens, offer sustainable business models, with the majority of revenues and earnings coming from recurring maintenance and services. In China, we are yet to enter this stage of growth. We are just passing the cyclical part of the growth path which is influenced by the government subsidy decision. But as the operator business model can be more sustainable over time (grid parity and the potential of long term Power Purchase Agreement), we see marginally less competition in the overall wind supply chain. All of these can improve the investment appeal of the sector and hence deserve a sector rerating over a longer period of time.
Section 5 – Utilities 2022 Market Outlook
Asia is leading global clean energy development with the largest amount of renewable power generation (~40% of global total) and investment.10 We estimate it will add 2.0TW of renewable power capacity over 2021-30 (~50% of global capacity addition), at an aggregate investment of US$1.4trn.11 The strongest potential lies in solar and wind power, given low generation mix (8% of total in 2020 vs ~30% in Germany and the UK) and grid-parity (cost competitive) in China, India and Australia. 12
China has the largest renewable capacity addition (1.4TW) in the next decade, while India has the highest renewable capacity 10-year CAGR (14%).13 Solar is the fastest-growing energy source for carbon neutrality in China and India, due to cost-competitiveness and strong policy support.
In 2021, power demand rose the most since 2011 – China’s power demand growth was high at +10.3% YOY in 2021, the highest in last ten years.14 China added 176.3GW (vs 191.4 GW added in 2020) new generation capacity in 2021, including 46.3GW thermal (56.6 GW added in 2020), 54.9GW solar (48.2 GW added in 2020), 47.6GW wind (72.1 GW added in 2020), 23.5GW hydro (13.1 GW added in 2020), and 3.4GW nuclear (1.1 GW added in 2020). 15
- The 14th Five-Year Plan’s focus on energy consumption and emission cut – The State Council’s Notice of Comprehensive Work Program on energy conservation and emission reduction related to the “14th Five-Year Plan” include –
- By 2025, China’s energy consumption per unit of GDP should drop by 13.5% compared with that of 2020, and
National emissions of chemical oxygen demand, ammonia nitrogen, nitrogen oxides and volatile organic compounds should drop by 8%, 8%, >10% and >10%, respectively, from those in 2020.
These targets would be achieved via ten measures covering a wide range of industries, including basic materials, renewables, properties, electric vehicles, transportation, chemicals and utilities. While these targets look in line, the announcement reiterates decarbonization as a top agenda item of the China government.
In 2022, we believe policy tailwinds will continue to favor clean energy driven capex by generation companies and grid-parity will continue to support the space.
Demand for energy storage capacity is also increasing. China ’s demand for energy storage capacity is rapidly growing, primarily due to more wind and solar capacity installation. Its energy storage capacity surged from 2-3GWh before 2021 to 20GWh in 2021.16 China has to add 100GWh energy storage capacity in the 14th Five-year Plan period (2021-25) to meet the regulatory requirement for wind and solar capacity, i.e. energy storage capacity equal to 10% of the renewable capacity, and energy storage capacity of two-hour duration, translating into energy storage capacity addition of 20GWh pa. Such installation would cost Rmb30bn each year. 17