Important Information
Investors should not base investment decisions on this website alone. Please refer to the Prospectus for details including product features and the risk factors. Investment involves risks. Past performance is not indicative of future performance. There is no guarantee of the repayment of the principal. Investors should note:
- Global X Innovative Bluechip Top 10 ETF (the “Fund’s”) seeks to provide investment results that, before deduction of fees and expenses, closely correspond to the performance of the Mirae Asset Global Innovative Bluechip Top 10 Index (the “Index”).
- The Index is a new index. The Index has minimal operating history by which investors can evaluate its previous performance. There can be no assurance as to the performance of the Index. The Fund may be riskier than other exchange traded funds tracking more established indices with longer operating history. The Index is an equal weighted index whereby the Index constituents will have the same weighting at each rebalancing (but not between each rebalancing) regardless of its size or market capitalisation based on the methodology of the Index.
- The Fund’s investments are concentrated in companies with a technology theme. Many of the companies with a high business exposure to a technology theme have a relatively short operating history. Technology companies are often characterised by relatively higher volatility in price performance when compared to other economic sectors. Companies in the technology sector also face intense competition, and there may also be substantial government intervention, which may have an adverse effect on profit margins. Rapid changes could render obsolete the products and services offered by these companies. These companies are also subject to the risks of loss or impairment of intellectual property rights or licences, cyber security risks resulting in undesirable legal, financial, operational and reputational consequences.
- The Fund’s investments are concentrated in companies in the technology sector. The Fund’s value may be more volatile than that of a fund with a more diverse portfolio. The value of the Fund may be more susceptible to adverse economic, political, policy, foreign exchange, liquidity, tax, legal or regulatory event affecting the technology sector.
- The number of constituents of the Index is fixed at 10. The Fund by tracking the Index may have a more concentrated investment portfolio than it would have held if tracking an index with a higher number of constituents, leading to higher risks of volatility.
- Underlying investments of the Fund may be denominated in currencies other than the base currency of the Fund. In addition, the base currency of the Fund is USD but the trading currency of the Fund is in HKD. The Net Asset Value of the Fund and its performance may be affected unfavourably by fluctuations in the exchange rates between these currencies and the base currency and by changes in exchange rate controls.
- As part of the securities lending transactions, there is a risk of shortfall of collateral value due to inaccurate pricing of the securities lent or change of value of securities lent. This may cause significant losses to the Fund. The borrower may fail to return the securities in a timely manner or at all. The Fund may suffer from a loss or delay when recovering the securities lent out. This may restrict the Fund’s ability in meeting delivery or payment obligations from redemption requests.
- The trading price of the Units on the SEHK is driven by market factors such as the demand and supply of the Units. Therefore, the Units may trade at a substantial premium or discount to the Fund’s Net Asset Value.
- Payments of distributions out of capital or effectively out of capital amounts to a return or withdrawal of part of an investor’s original investment or from any capital gains attributable to that original investment. Any such distributions may result in an immediate reduction in the Net Asset Value per Unit of the Fund and will reduce the capital available for future investment.
Global EV and Battery – The Chinese Giants Will Emerge Stronger
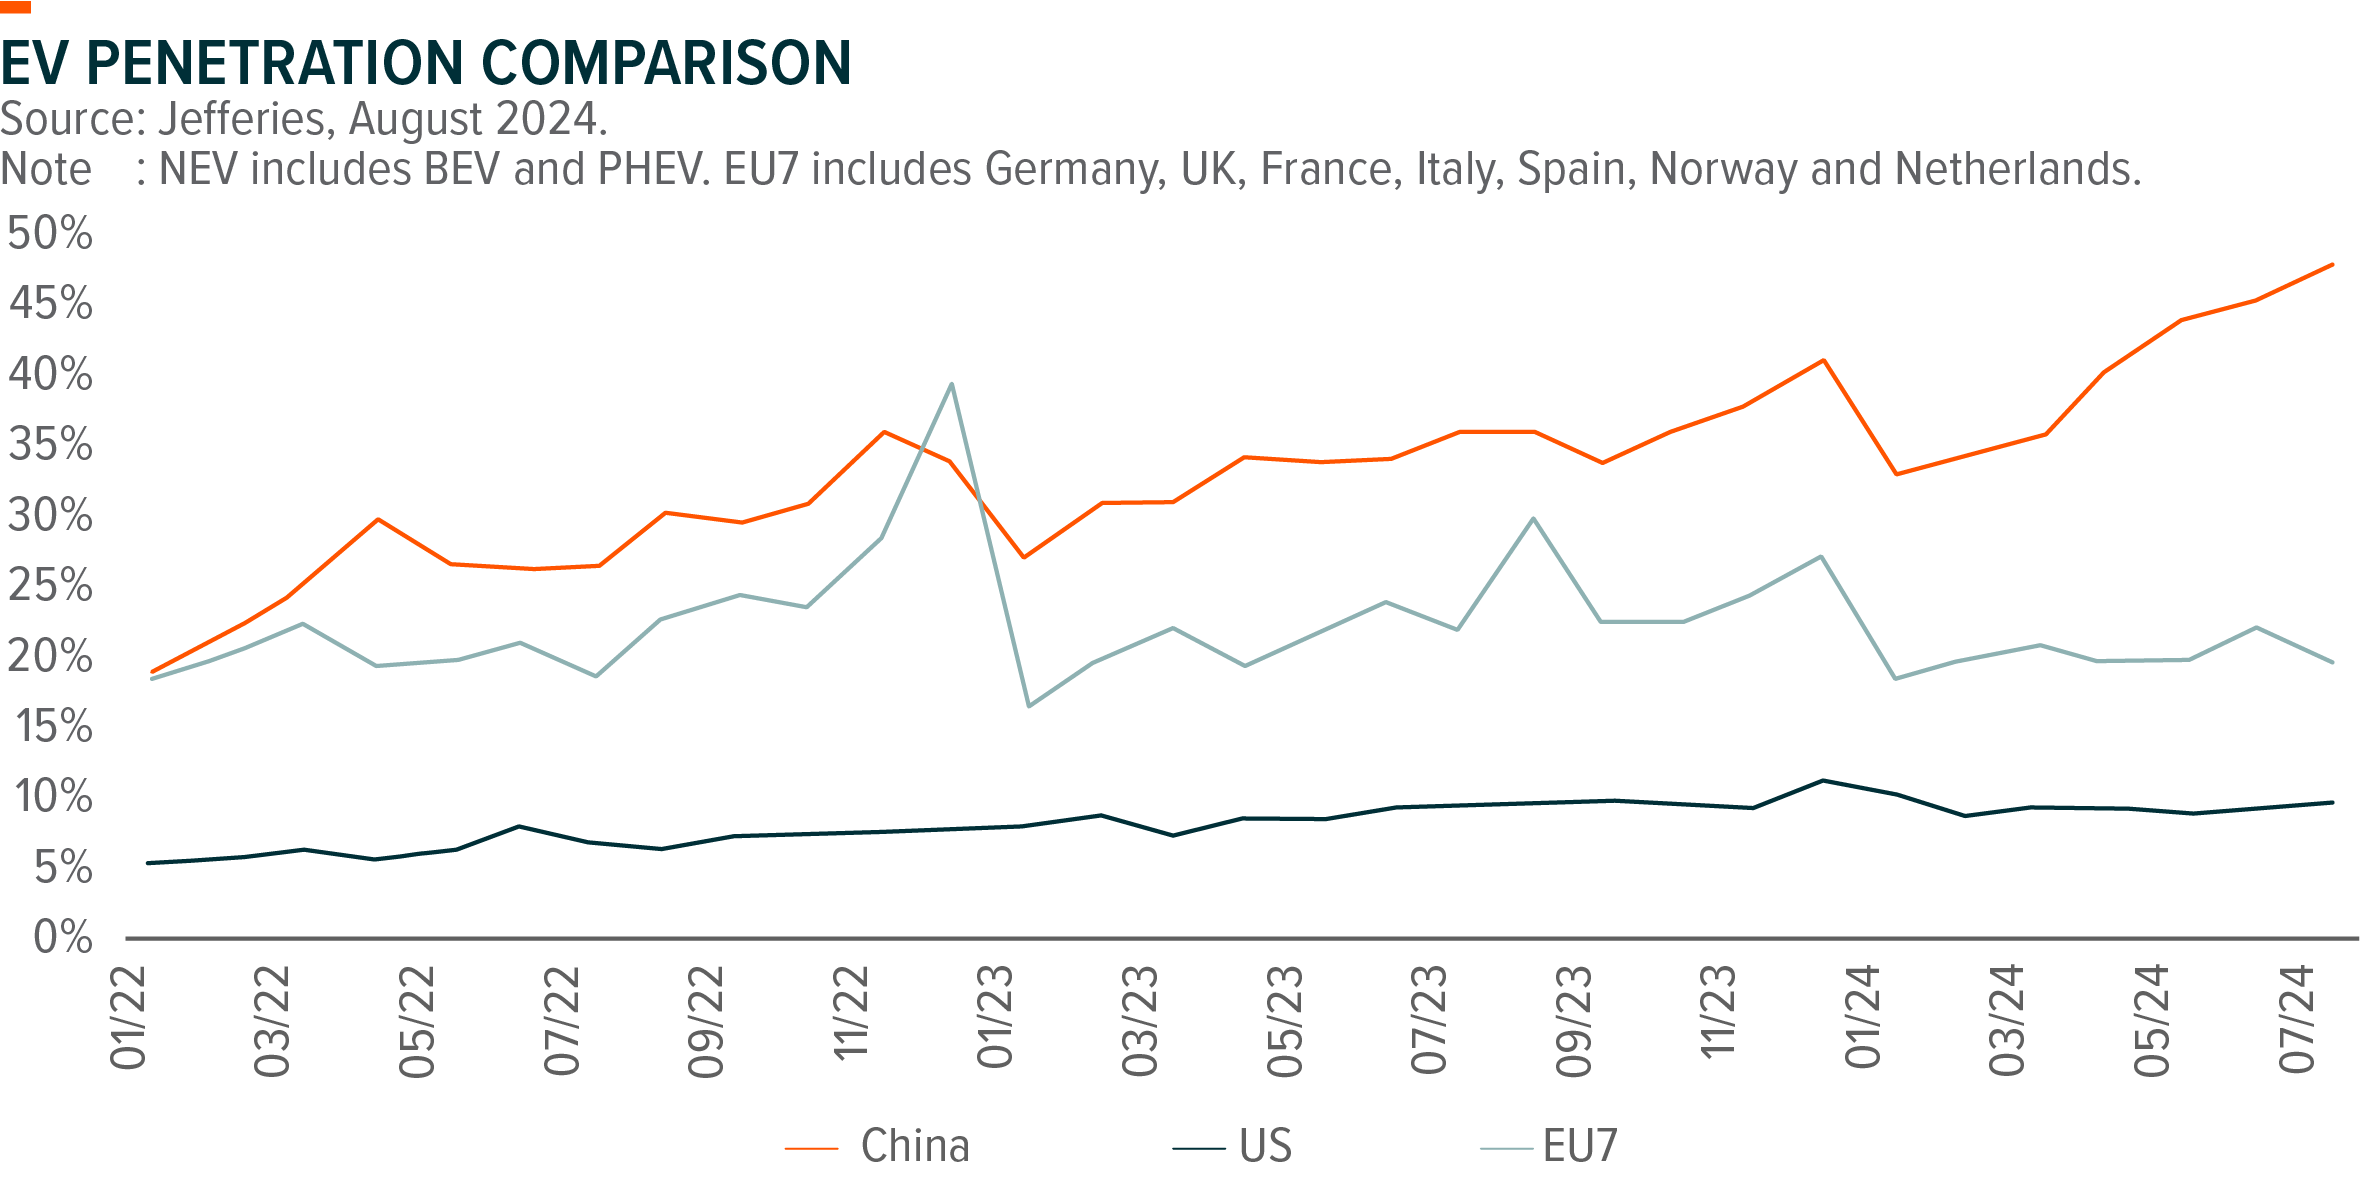
In the wave of global EV transition, China emerges as a global leader thanks to the ramp-up of charging infrastructure, rapid launches of competitive models, and rising awareness of consumers. China EV (including BEV and PHEV) penetration reaches 45%+ in past months, substantially higher than EU (c.20%) and US (c.10%), and China accounts for over half of EV sales globally. Across global EV value chain, Chinese enterprises are gaining traction, commanding the largest global share in EV (BYD) and battery (CATL) market. In a rapidly evolving industry, we see the solid cash position and strong R&D capability as the key for BYD and CATL to fend off competition and sustain leading positions.
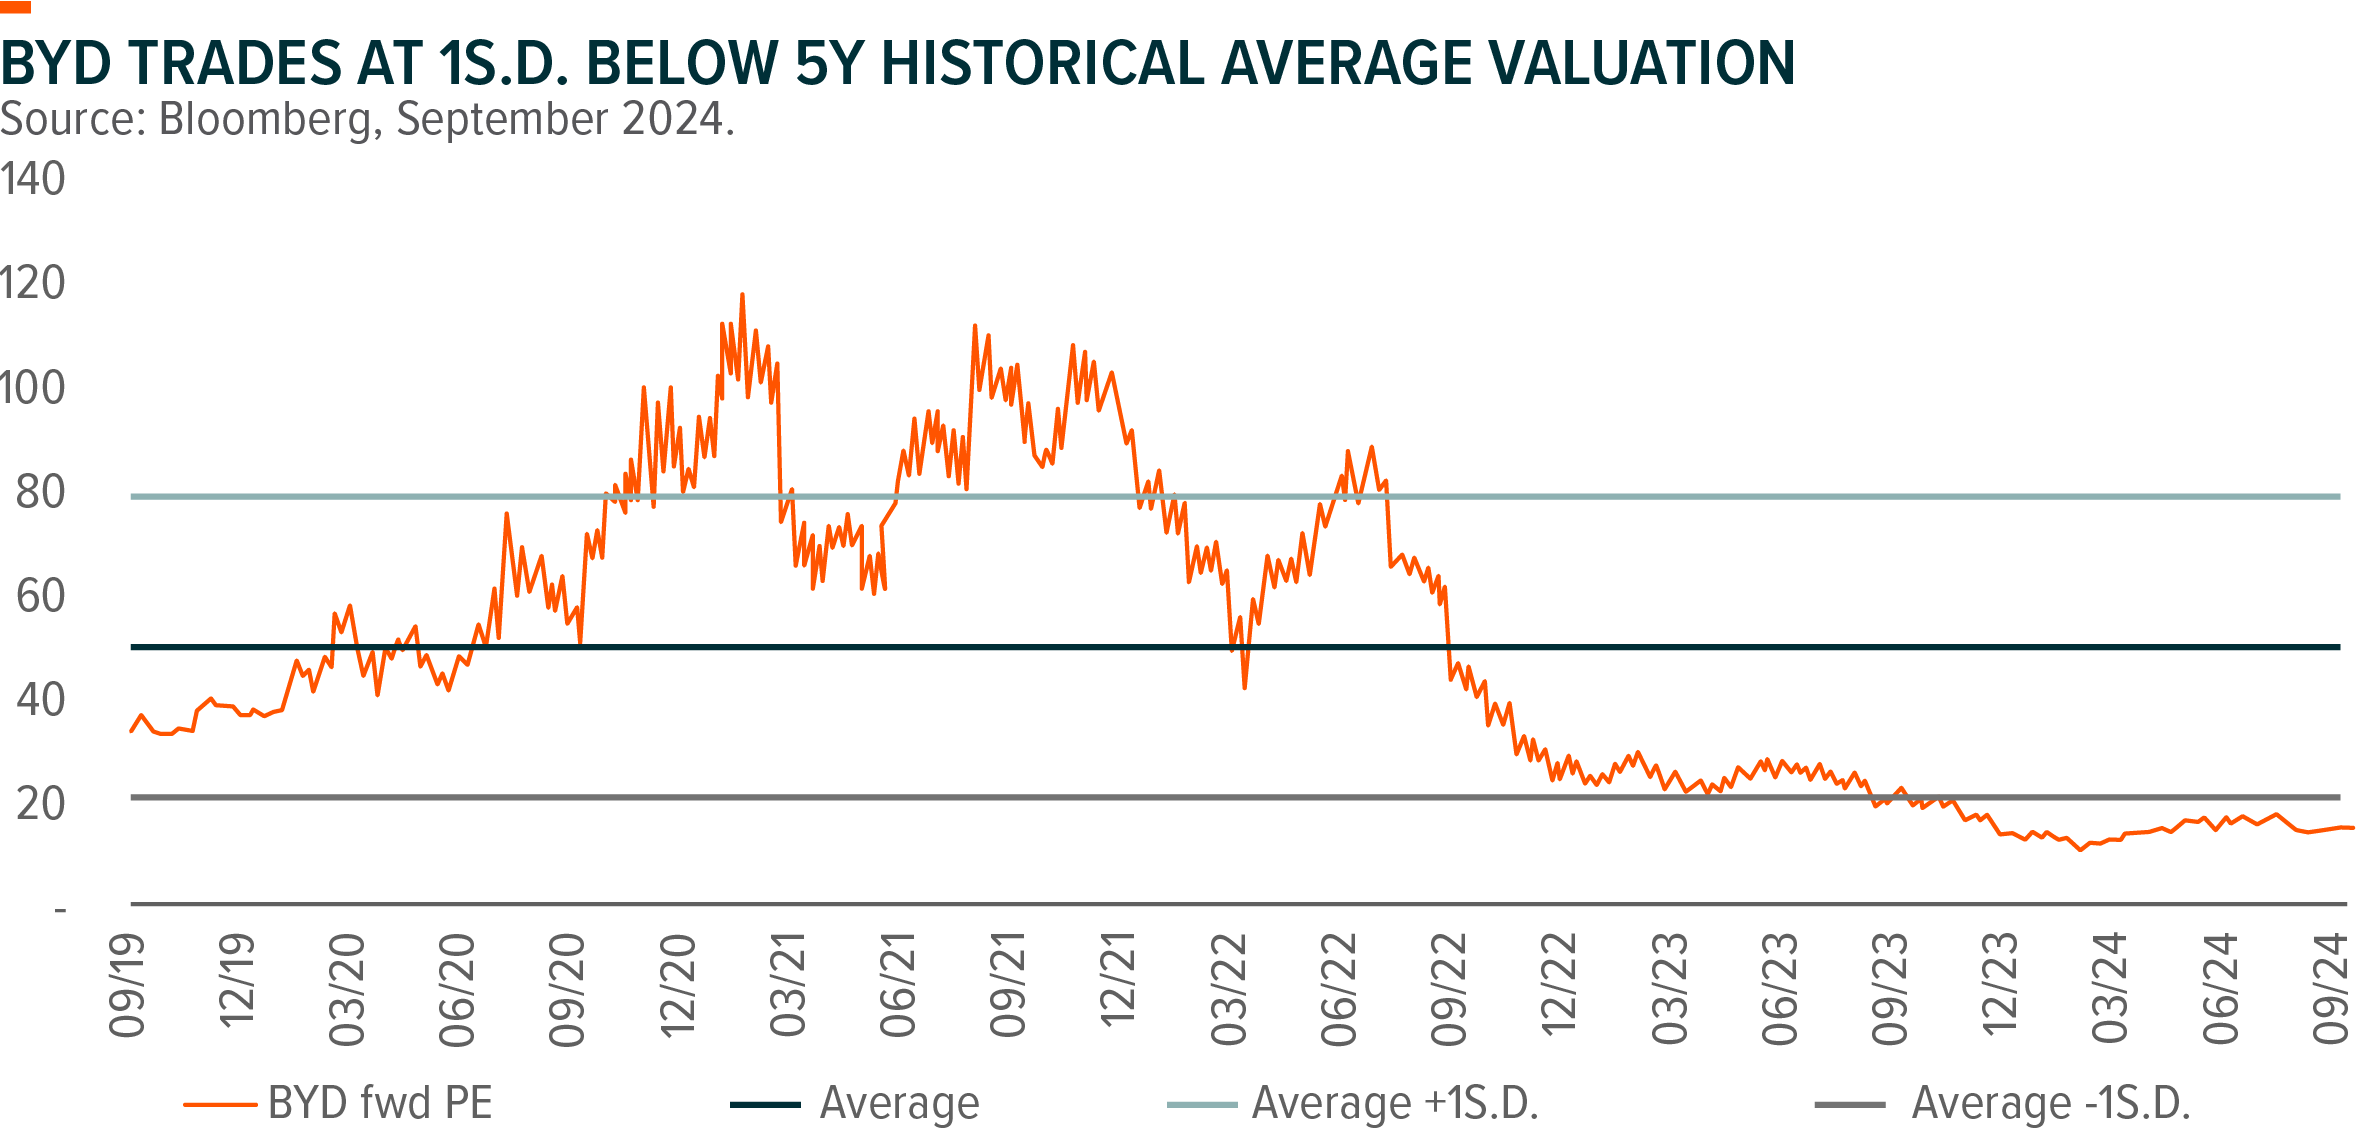
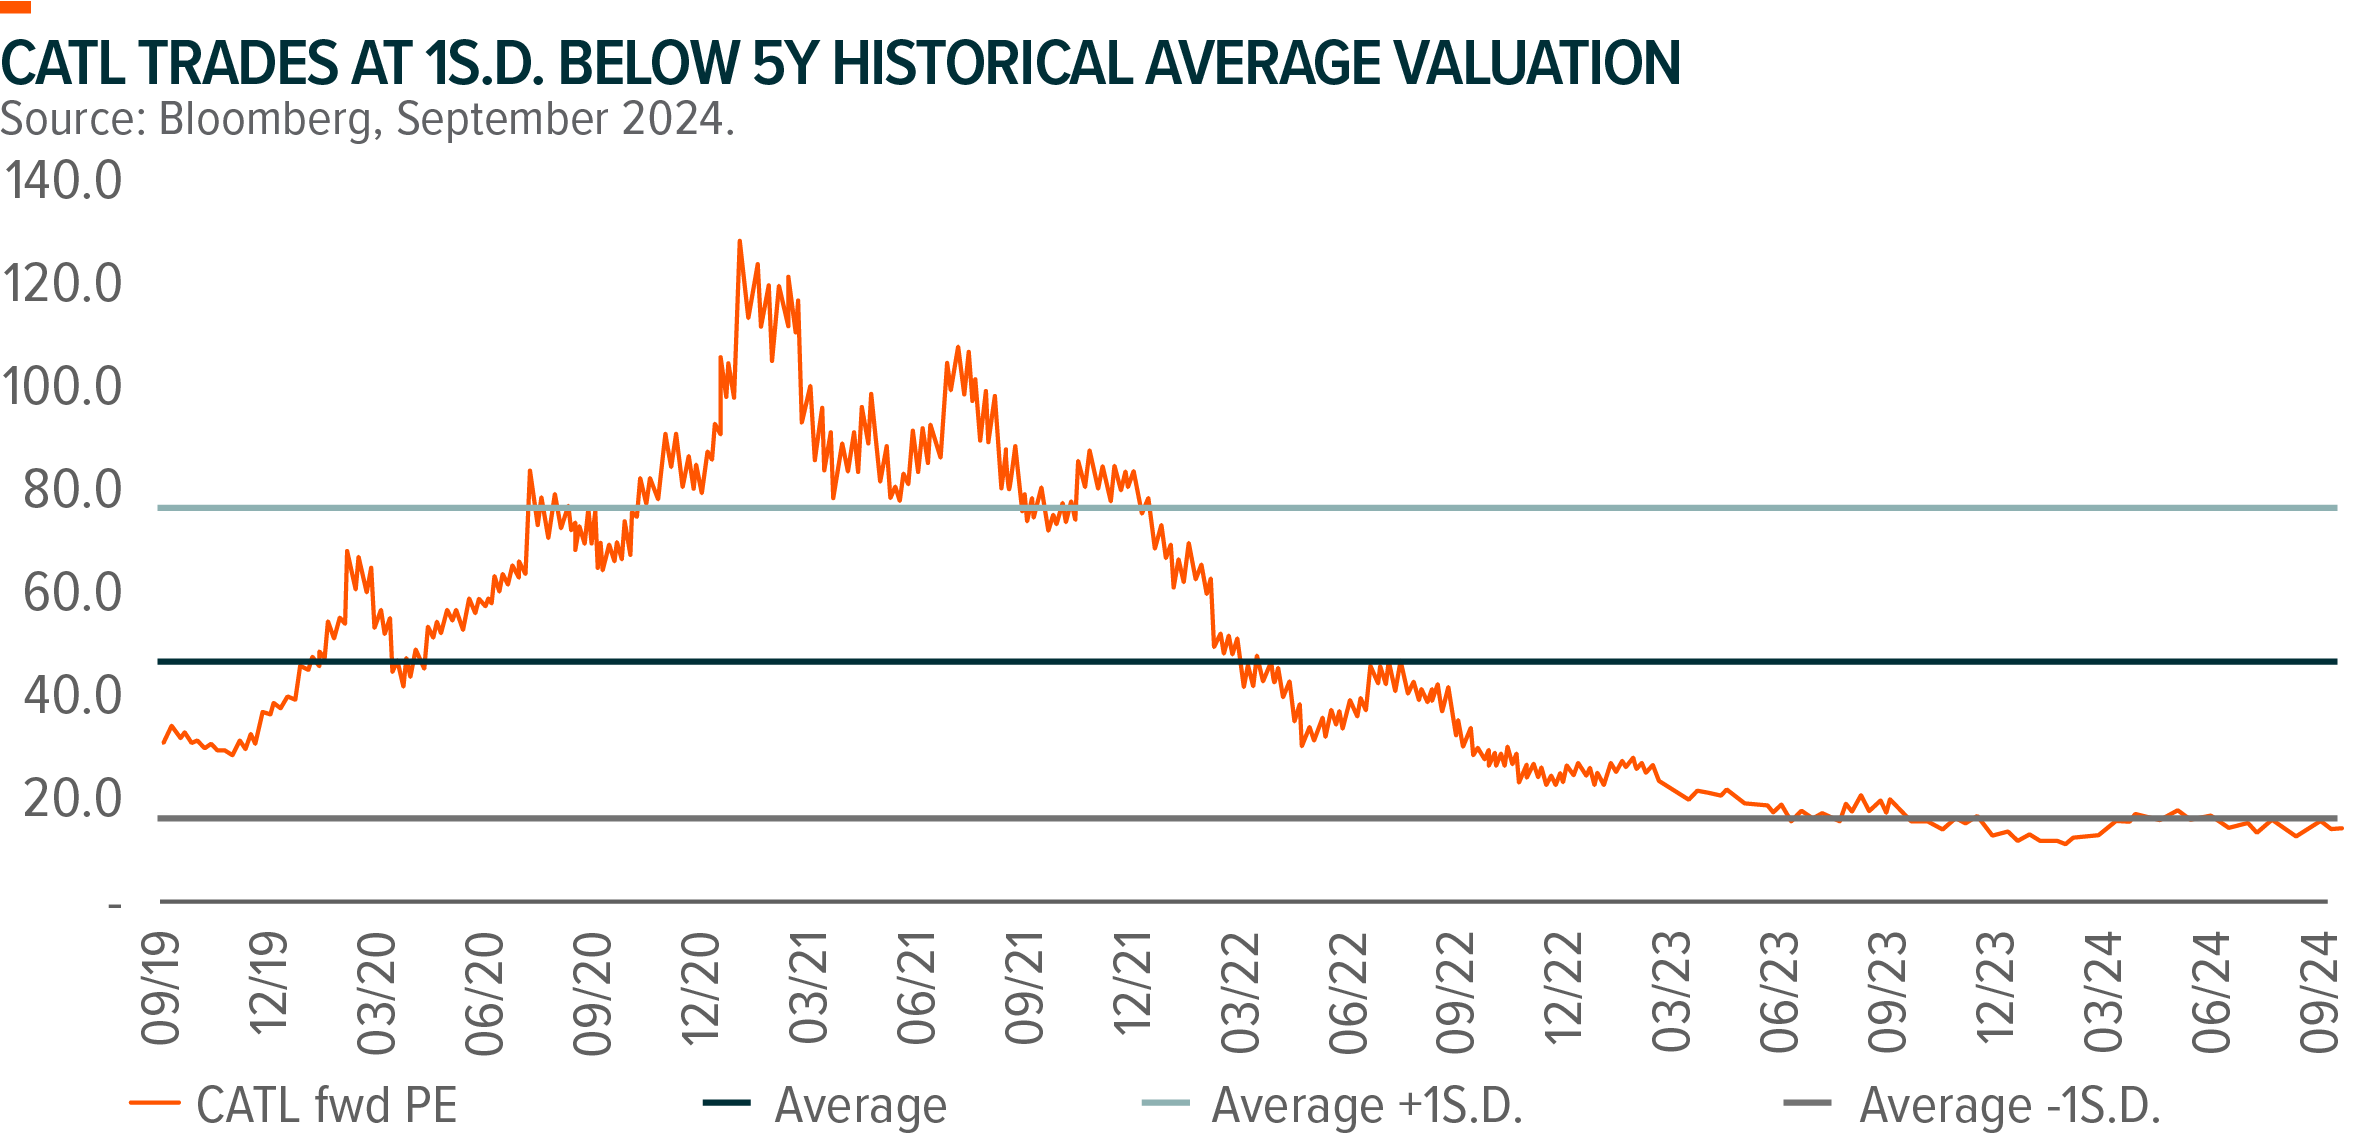
Albeit with strong product and cost competitiveness as well as solid growth outlook, BYD and CATL currently trade at undemanding valuations, offering a compelling opportunity for investors seeking to capitalize on the global EV development. BYD and CATL are key holdings for Global X Innovative Bluechip Top 10 ETF (3422 HK) with combined weighting of c.20%.
BYD – More Than a Cost Leader
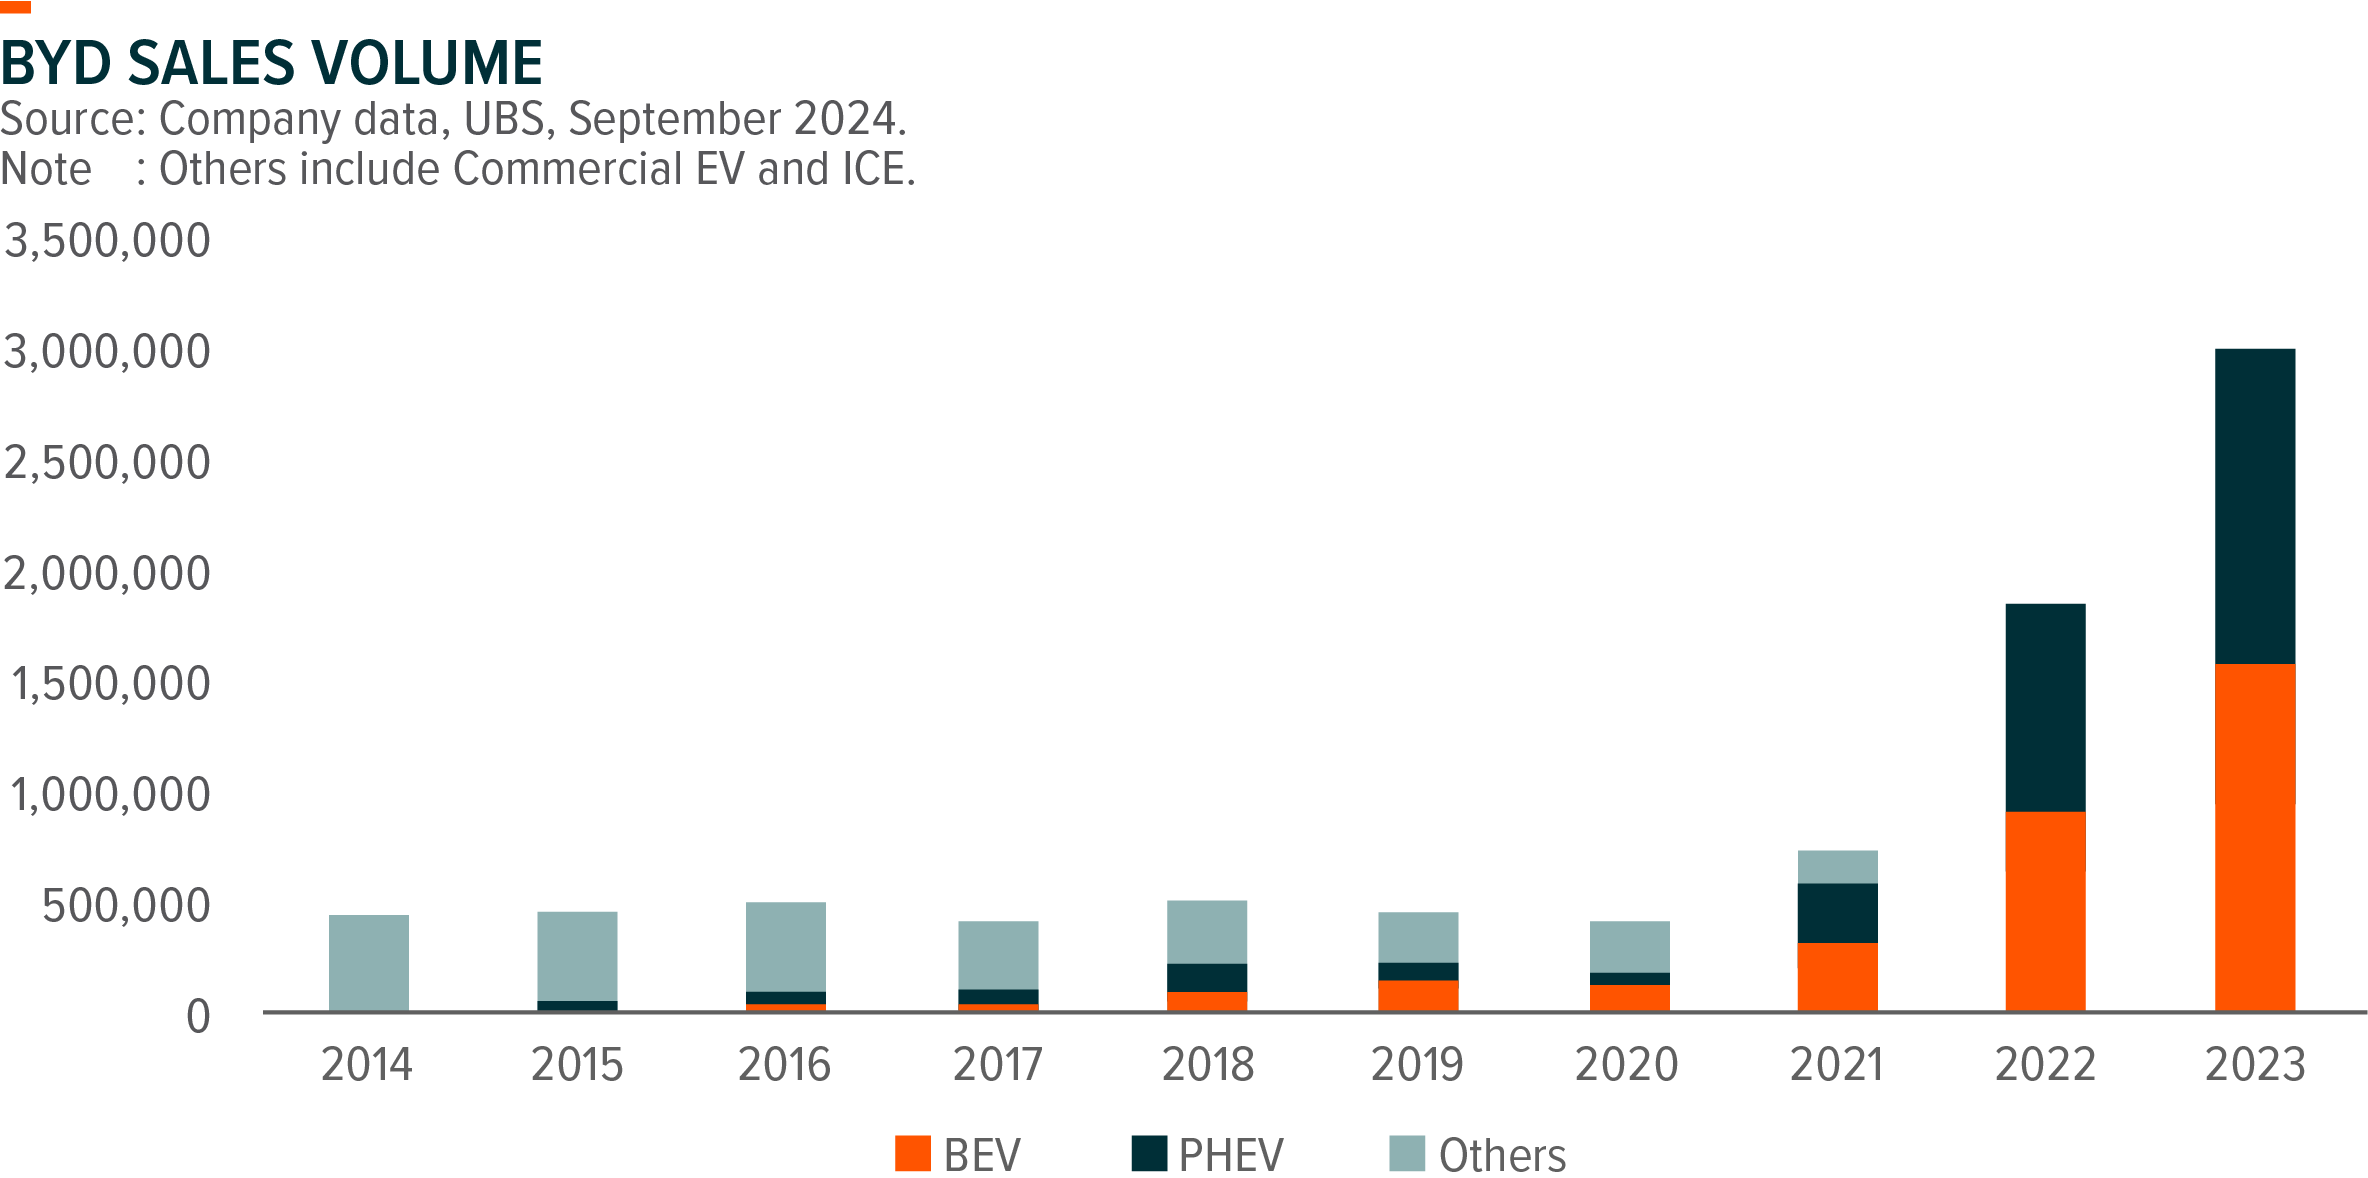
On the back of the surging NEV demand in China, BYD sold over 3mn units of NEVs (including 1.4mn units of PHEVs and 1.6mn units of BEVs) in 2023, and is on track to reach its 4mn units sales target in 2024, making it the largest NEV company (by volume) globally. Starting as a mass-market automaker, BYD’s superior cost basis and strong vertical integration helps the company capture the window of opportunities at the initial stage of EV transition, while its leading proprietary technology, improving brand recognition, and ongoing premiumization trajectory should support BYD to further capture global EV market share in a more profitable manner going forward.
Amid fierce competition, we see better sustainability for BYD with its healthy cash positions and strong R&D capabilities as compared to other loss-making peers, positioning the company as one of the best options to help investors capture the structural trend of vehicle electrification globally.
Technology leadership is the core to BYD’s dominance. Company expect R&D expenses in 2024 to continue ramp up vs 2023 (Rmb40bn) and R&D/Revenue will remain stable, as supported by the solid cash position (Rmb 68bn Net Cash in 2023) and strong FCF generated (Rmb 47bn FCF in 2023). BYD’s dedicated investments in R&D foster its leading technology (Proprietary cell-to-pack Blade batteries and DM-i technology) and rich product pipeline. Further roll out of DM-i 5.0 to more models and improving product mix should improve profitability outlook even in a highly competitive market.
Though still facing tariff uncertainty, overseas expansion should remain a key driver for BYD thanks to its established core battery technologies, model platform, and improving brand recognition. BYD’s strategy to invest in local production facilities should mitigate tariff uncertainty, and BYD will have 3 wholly-owned overseas factories with total annual capacity of 450k units by end-2025. BYD has entered into over 70 countries and regions, and we see potential for BYD to further penetrate into emerging markets such as Southeast Asia and South America as its price-competitive and quality products should cater to local consumer preference. Brazil, Thailand and Israel remain the top 3 export destinations for BYD YTD.
With persistent range anxiety among consumers and a shortage of rapid-charging stations, PHEV models are seeing booming demand and have become the key driver for NEV growth. BYD’s latest DM-i 5.0 technology brings greater fuel efficiency, longer range, and higher engine thermal efficiency, further enhancing the competitiveness of its PHEV models. Amid fierce competition, many mass-market JVs have been loss making in China since 2024, which could accelerate a strategic retreat by global carmakers from China market. This leaves BYD an opportunity to further gain market share driven by its product and price competitiveness, as well as rising brand equity.
CATL – Global Leader with Superior Battery Products
Overcapacity drove a deteriorating landscape in battery industry over the past 2 years, but we could be seeing an inflection point as supply-demand dynamics continue to improve. On supply side, Capex for Chinese battery makers decreased by over 50% from the peak, and planned annual Capex of key players for 2024/25E have also been revised down substantially. Continued Capex deceleration should drive a subsequent decrease in capacity. On demand side, China battery domestic shipment grew by c.40% YoY in 1H24, according to CABIA, as supported by resilient EV demand and growing ESS demand. Improving supply-demand dynamics should drive a gradual recovery in capacity utilization rate and support improving margin for key players.

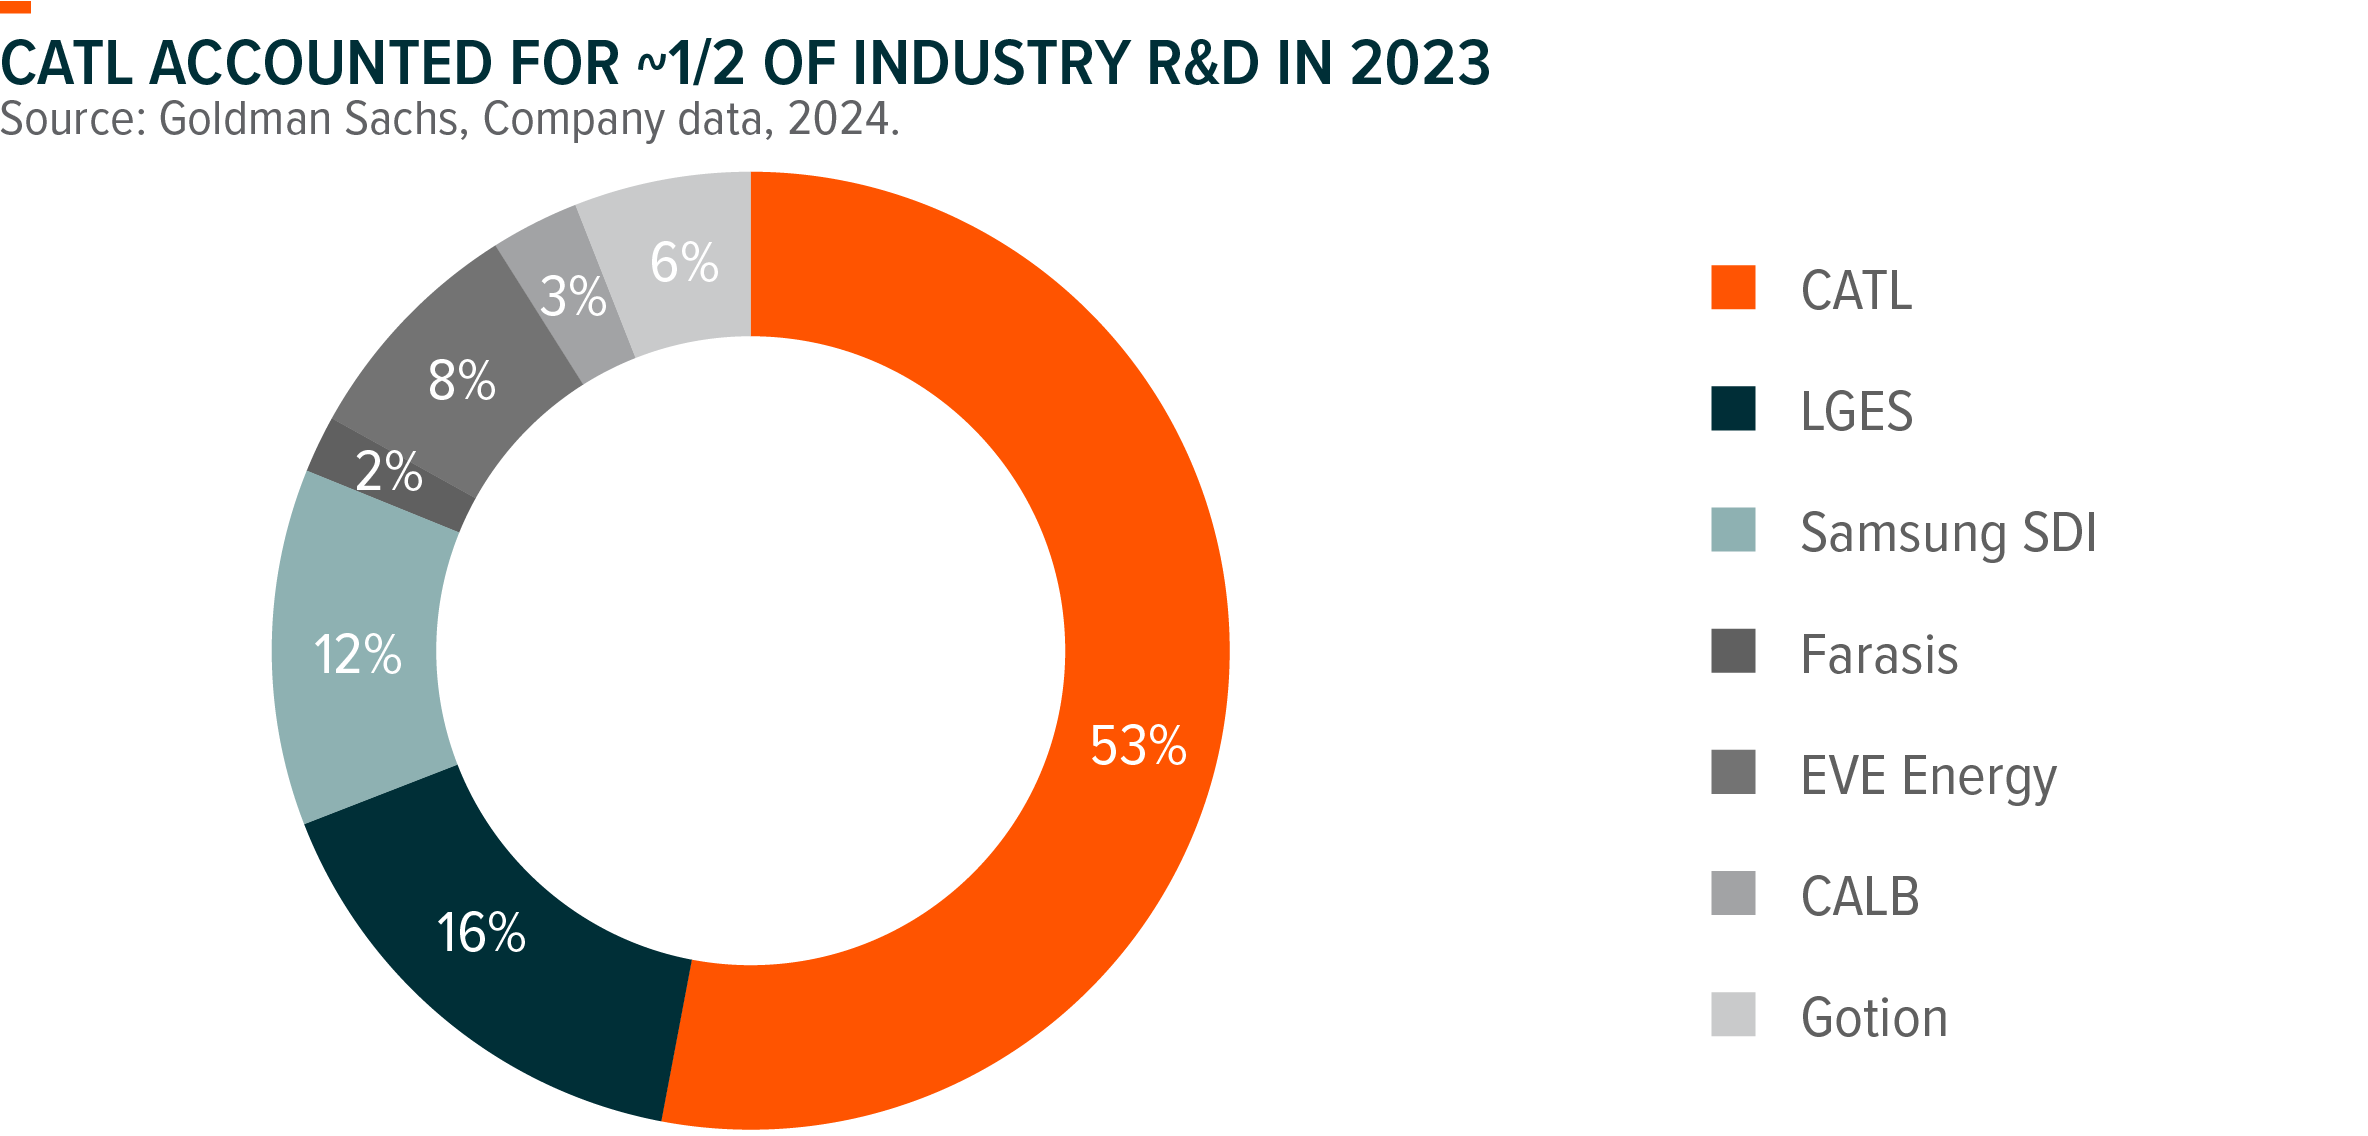
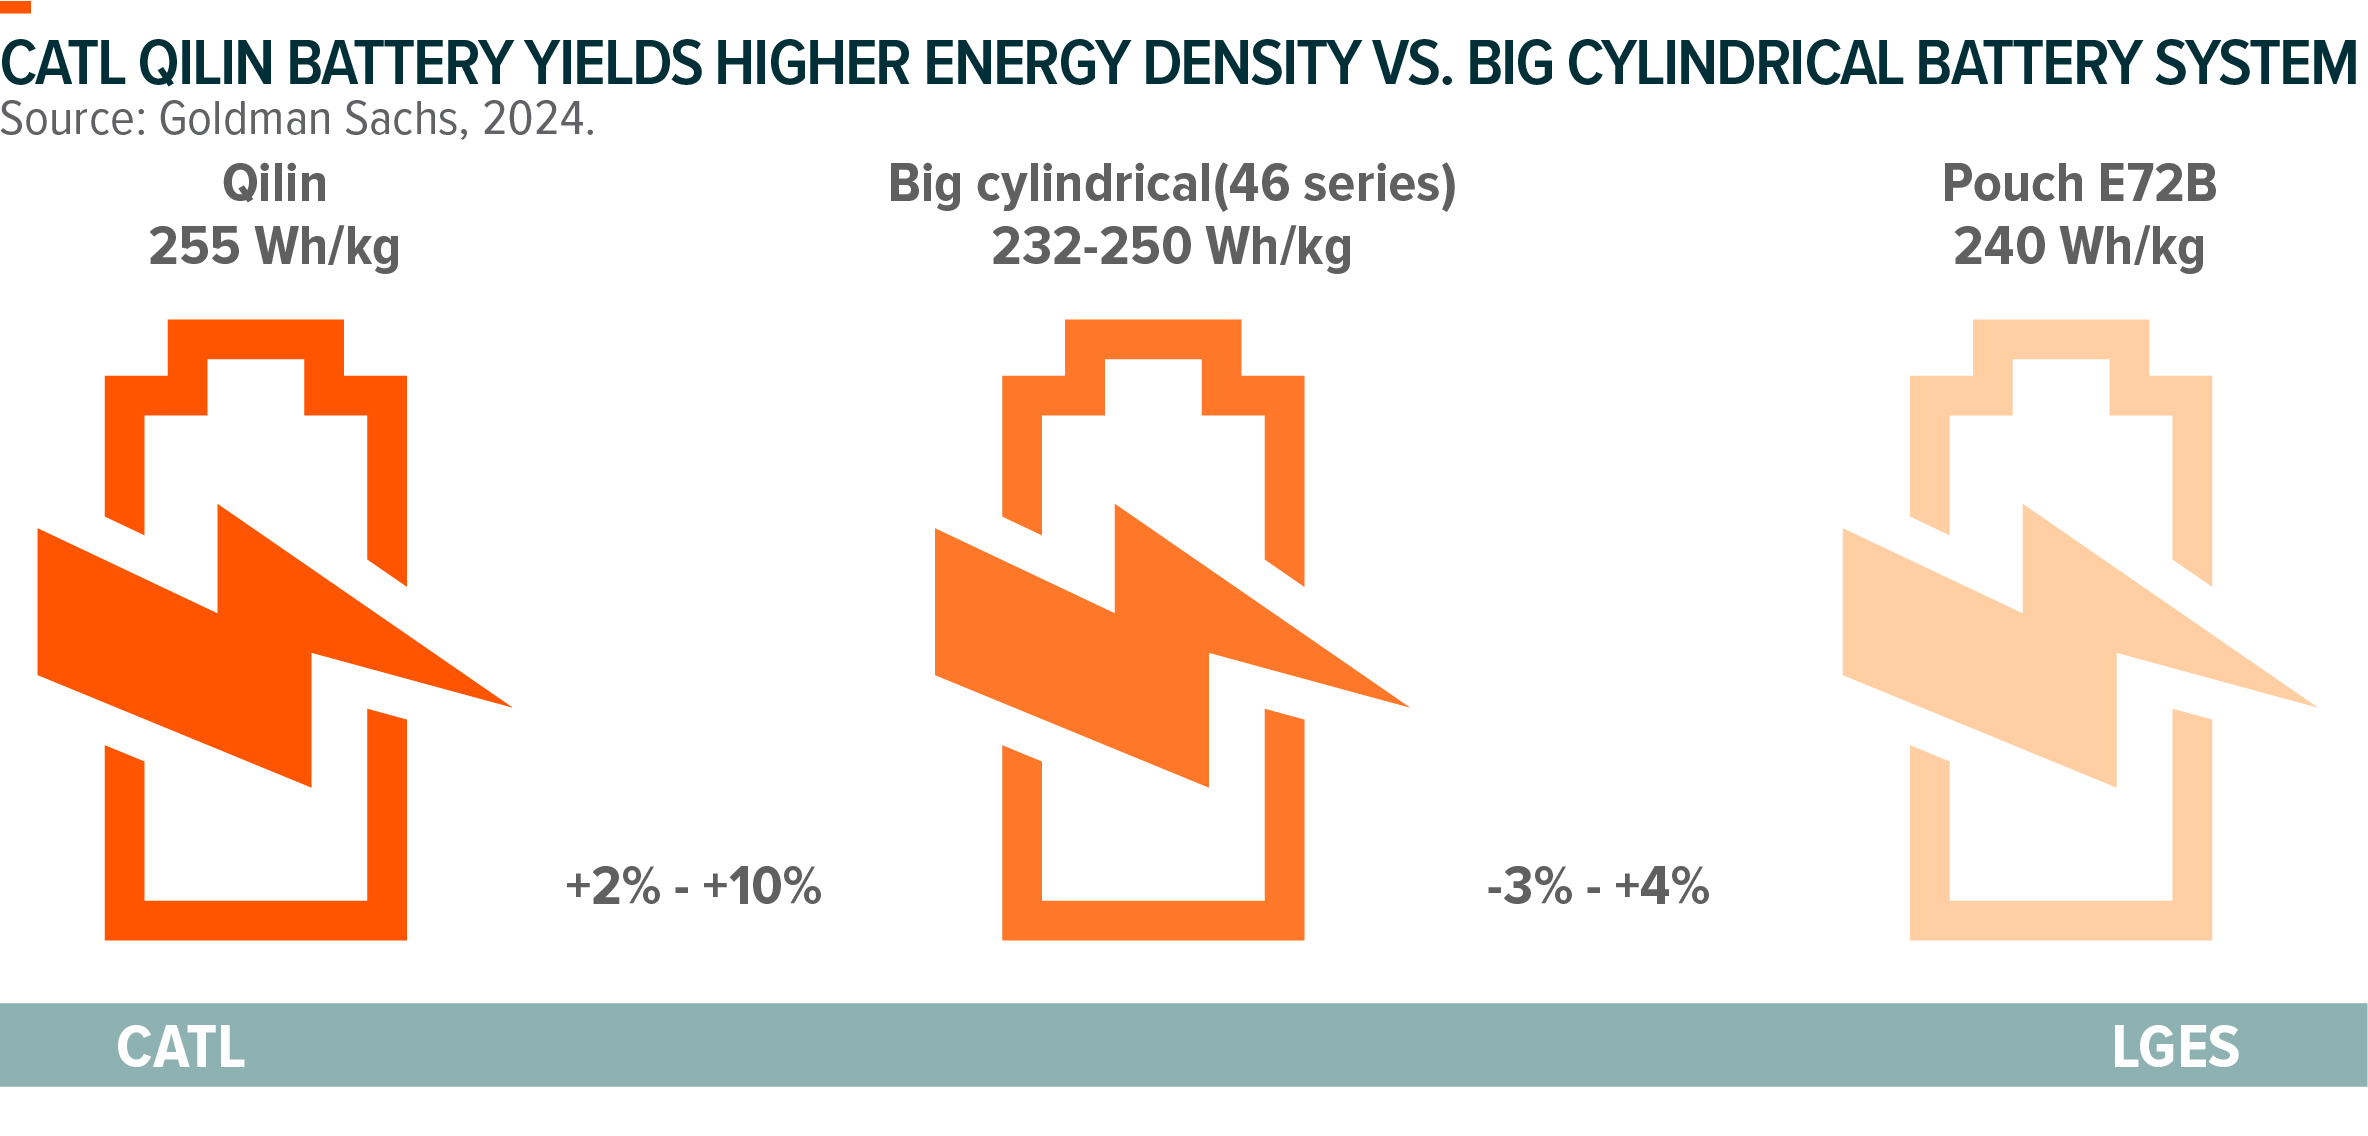
CATL is the largest battery maker globally, commanding c.40% global battery market share. CATL’s dominant position is bolstered by its superior battery products, featuring higher energy density and better quality, and the company enjoys a well-diversified client base covering leading EV OEMs globally. CATL’s battery yields higher energy density in both NCM space (Qilin Battery) and LFP space (Shenxing Plus Battery), thus enjoying price premiums compared to peer products. In addition, CATL battery offers better reliability, as evidenced by its lower warranty compensation ratio among peers. CATL’s solid cash positions and commitment in R&D should help sustain its competitive advantages in the long run.
CATL’s superior energy density brings both cost savings and price premiums for its battery, leading to better profitability compared to peers. CATL remains its dominant position in mid-high end market, and ongoing product premiumization trajectory through higher adoption in Energy Storage, Commercial Vehicles, Premium PV and Overseas should also contribute to profitability expansion. CATL expects its GP/unit to stay stable at around ~Rmb200/kWh, a substantial premium compared to peers.
Volume outlook remains solid at 20%+ YoY in 2024E as driven by solid ESS growth and resilient domestic EV demand. Overseas landscape is improving, with CATL’s Hungarian plant is on track for production in 2025, and its LRS cooperation in the US is also progressing steadily. CATL remains confident in the Europe market, stating that it will be the major supplier to European core OEMs’ new EV pipelines. ESS growth is expected to further accelerate in 2025E as US will step up tariffs on ESS batteries in 2026.
Related Global X ETFs’ Product1
| Global X Innovative Bluechip Top 10 ETF (3422 HK) | |
|---|---|
| Inception Date | 24 Nov 2023 |
| Reference Index | Mirae Asset Global Innovative Bluechip Top 10 Index2 |
| Primary Exchange | Hong Kong Stock Exchange |
| Ongoing Charges Over A Year | 0.68% p.a. |
| Product Page | Link |
The Fund adopts a single management fee structure, whereby a single flat fee will be paid out of the assets of the Fund to cover all of the costs, fees and expenses of the Fund. As the Fund is newly set up, this figure is an estimate only and represents the sum of the estimated ongoing charges over a 12-month period, expressed as a percentage of the estimated average Net Asset Value of the Listed Class of Units of the Fund over the same period. It may be different upon actual operation of the Fund and may vary from year to year. As the Fund adopts a single management fee structure, the estimated ongoing charges of the Fund will be equal to the amount of the single management fee, which is capped at 0.68% of the average Net Asset Value of the Listed Class of Units of the Fund. Any ongoing expenses exceeding 0.68% of the average Net Asset Value of the Listed Class of Units of the Fund will be borne by the Manager and will not be charged to the Fund. Please refer to the Key Facts Statement and the Prospectus for further details.

